
How To Get Here?
- From the Menu
- Sales–> Sales Statistics, by default
- Or, if you are on the By Date or on the Chart View tab of the screen, clicking on the By Product tab just below the 4 colored tiles will bring you back to this screen
What is it for?
- Allows a detailed inspection of the most important sales statistical data, within a selected time period, sliced in different views
- There are two versions of the Sales Statistics Screen
- One showing aggregate (sum) data ALL products combined. This version will show ‘Sales Statistics – All Products’ in the title.
- One showing individual data for ONE product. This version will show ‘Sales Statistics – SKU / ASIN / Internal Name’ in the title.
- This screen shows data for products which have had activity during the selected period only!
- Activity relates to sales, or refunds or PPC costs during the period selected
- Shows the most important sales data points
- By Product, for all products combined within your chosen period
- By Date, for all products combined within your chosen period
- By Chart, for all products combined within your chosen period
- By individual product, by date
- By individual product, by chart
Hints And Tips!
- We anticipate many sellers will prefer this screen to become their homepage, replacing the standard default dashboard by the Sales Statistics Screen – Dashboard Edition
- You can easily achieve this by clicking on the Home icon (Set Home Page) on the top taskbar when showing the Sales Statistics screen
- If you wonder why a specific product does not show in the list, it is very likely because it has not had any activity during the selected period
- Bear in mind that a product can have 0 revenue and still show in the list because it had a refund.
- Curious to know what the color coding means? Please read the following article
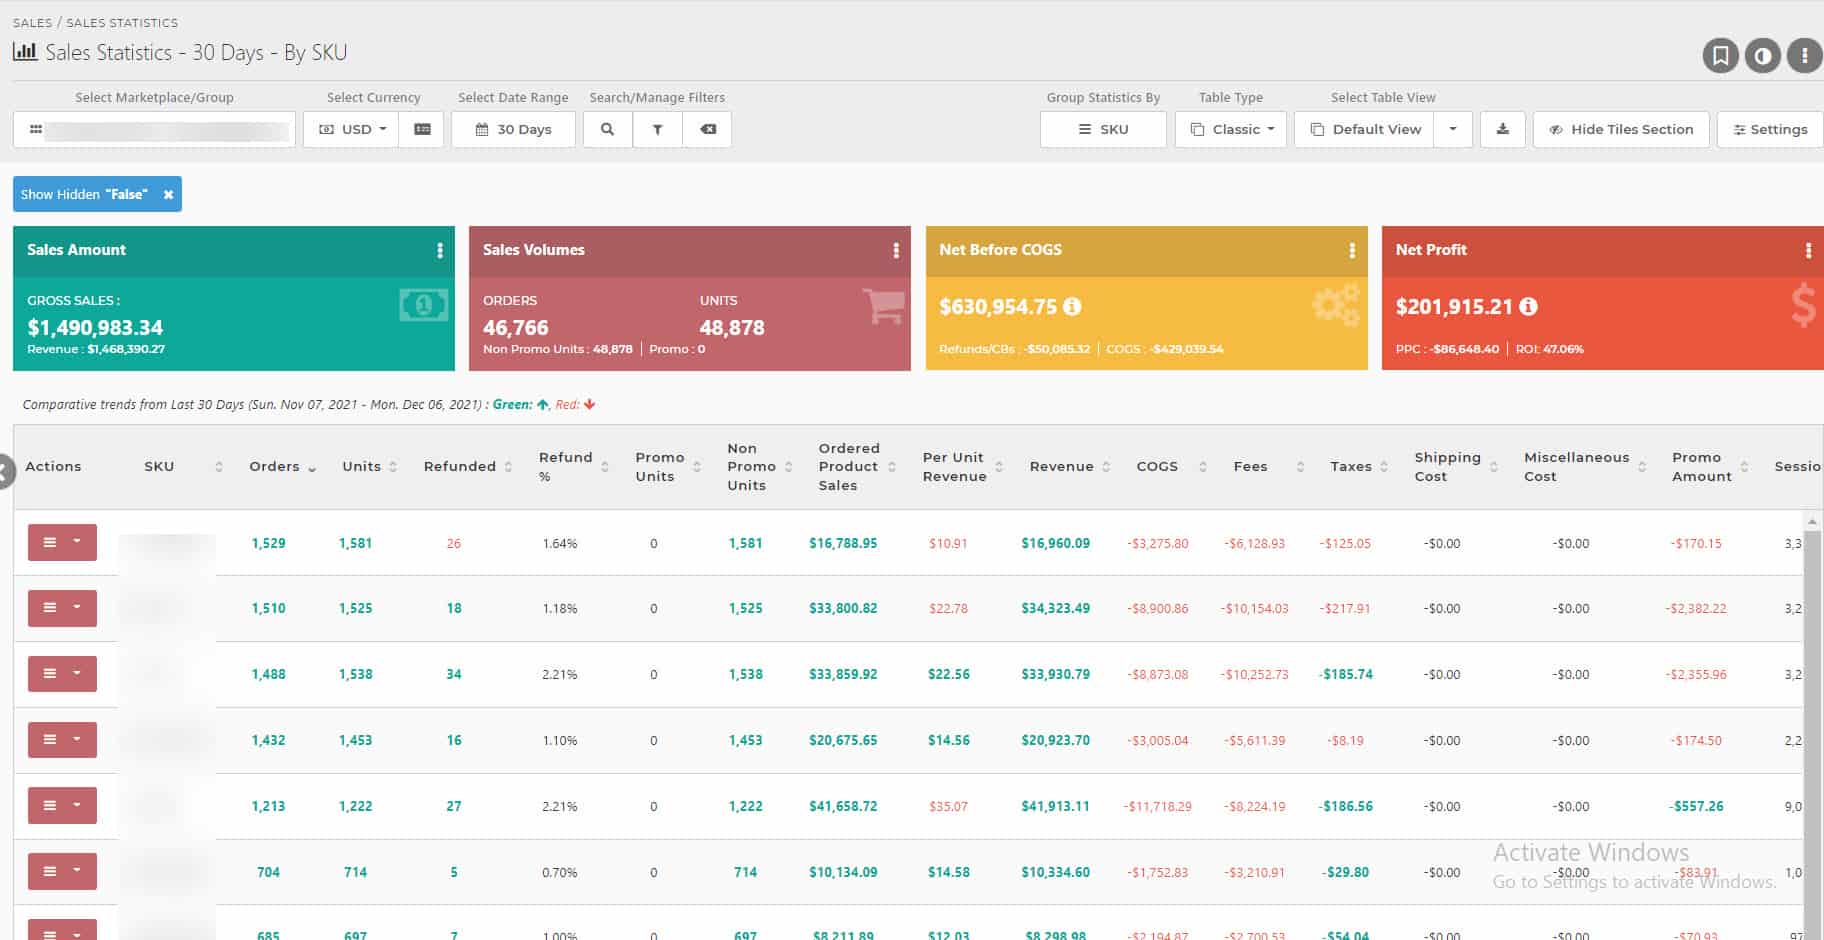
Screen Print
Content
(*) denotes features not yet implemented at the time of writing
- The Sales Statistics screen is constituted of
- Four colored tiles at the top of the screen showing selected sales KPI’s
- A navigation bar that allows the selection of a preferred view of the sales statistics data
- A date picker, which allows selection of a series of date periods
- A table below the navigation bar, which reflects the data view predicated by your selection in the navigation bar
The Colored Tiles
- The tiles reflect aggregate (sum) values pertaining to ALL products with activity during the selected period
- Gross Sales (Gross Revenue)
- The sum of all sales for all the products with activity during the selected period
- Please note that the impact of Refunds is already accounted for in Gross Sales
- Net Revenue
- Gross Sales minus the sum of all Promo Amounts discounted for all the products with activity during the selected period
- Orders
- The number of orders placed for all products with activity during the selected period
- Units
- The number of units ordered for all products with activity during the selected period
- Non Promo Units
- The number of non promo units ordered for all products with activity during the selected period
- Learn how SellerLegend identifies promotional orders
- Net Before COGS
- The Gross Sales minus FBA Fees, Promo Amount, PPC Costs, VAT, and Operating Expenses incurred for all products with activity during the selected period
- COGS Amount
- The sum of all the Cost Of Goods (COGS) relating to all the units sold for all products with activity during the selected period
- Learn how to define and use period based COGS
- Net Profit
- Net Before COGS minus Cost Of Goods amount
- PPC Costs
- Advertising costs for all products with activity during the selected period
- When the report is grouped by ID, the PPC costs consist of Sponsored Products only.
- When the report is grouped by ASIN, the PPC costs consist of Sponsored products, Sponsored Display and Sponsored Video.
- ROI (Return On Investment)
- Aggregate ROI for all products with activity during the selected period
- The Information Icon (Profit Breakdown)
- Clicking on this icon will present a drop-down showing a waterfall view of all the sales values and how they are calculated
The Navigation Bar
- Allows navigation to the different views of Sales Statistics
- By Product will show this screen
- By Date will show The Sales Statistics Screen – Dashboard Edition – By Date screen
- Chart View will show The Sales Statistics Screen – Dashboard Edition – Char View screen
- If you wish to view the old version of the Sales Statistics, click on the link next to ‘Looking for old version?’
The Date Picker
- Use the date picker to select from any of the following periods
- Today
- Yesterday
- 7 Days
- 30 Days
- 60 Days
- 90 Days
- This Month
- Last Month
- 3 Months
- Last Year
- Year to Date
- One Year
- Any custom date range
The Data Table View
- The Data Table reflects individual values for each product
- Actions Button
- On every product line within the table, clicking on the Actions button will reveal a link to:
- View the statistics of the selected product by date (View This Product By Date)
- View the statistics of the selected product represented in a chart (View This Product In Chart View)
- On every product line within the table, clicking on the Actions button will reveal a link to:
- Product Image
- The small image of the product
- Clicking on the image will take you to the Product Modal for that product
- Product Title
- The Title of the product as it appears on your Amazon listing
- Account Title
- Title of the account the product belongs to
- Marketplace
- The marketplace the product belongs to
- The marketplace shown in this screen is governed by the Marketplace Selector (to the left of the question mark help icon in the top right side of the taskbar)
- SKU
- The Stock Keeping Unit number of the product
- FNSKU
- The Fulfilment Network Stock Keeping Unit number of the product
- ASIN
- The ASIN of the product
- Clicking on the ASIN will take you to your product’s listing on the Amazon catalog
- SellerLegend uses the short URL version of your ASIN to take you to the product listing. Clicking on the ASIN, therefore, does not adversely impact your conversion rates.
- Internal Name
- The Internal Name you have assigned to the product.
- Learn how to assign Internal Names to products
- Brand
- The product’s Brand as specified on the Amazon listing
- By using the Filters or the Omni-Search bar, this allows you to quickly view all the products for a specific Brand
- Product Group
- The Product Group this product is assigned to
- By using the Filters or the Omni-Search bar, this allows you to quickly view all the products for a specific Product Group
- Learn how to Define And Assign Product Groups
- Tags
- Any Tags associated with the product
- By using the Filters or the Omni-Search bar, this allows you to quickly view all the products featuring the same Tag(s)
- Learn how to assign Tags to products
- Orders
- The total number of orders placed for this product during the selected period
- Units
- The total number of units sold for this product during the selected period
- Velocity
- The total number of units sold per day on average for this product during the selected period
- Refunded
- The total number of units refunded for this product during the selected period
- Learn how SellerLegend handles Refunds
- Promo Units
- The total number of promotional units sold for this product during the selected period
- Learn how SellerLegend identifies promotional orders
- Non Promo Units
- The total number of non promo units sold for this product during the selected period
- Revenue
- The total Gross Revenue earned for this product during the selected period
- COGS
- Learn how to Assign COGS To Products
- The sum of all the Cost Of Goods (COGS) relating to all the units sold for this product during the selected period
- FBA Fees
- The sum of all the FBA Fees relating to all the units sold for this product during the selected period
- Commissions
- Previously commissions were a part of the breakdown in the FBA Fees Column
- This column shows the commission paid for that specific product.
- Hovering over the column will show you the breakdown of the commissions.
- VAT
- The Europe Value Added Tax (VAT) element charged on the Revenue generated by the sales of this product during the selected period
- Promo Amount
- The promotion discount amount relating to all the units sold for this product during the selected period
- Sessions
- The number of sessions for this product during the selected period
- This data point will not be present unless you have downloaded the performance data through the SellerLegend Chrome extension
- PPC Conversions
- The number of conversions for this product during the selected period
- This data point will not be present unless you have downloaded the performance data through the SellerLegend Chrome extension
- PPC Cost
- The total PPC advertising costs incurred for this product during the selected period
- OOE
- The total amount of product-related Other Operating Expenses (OOEs) incurred for this product during the selected period
- Please note that marketplace-related OOEs are obviously not included in this amount, as they are not product-related OOEs
- Therefore, it is possible for the profit in the colored tiles at the top not to be equal to the sum of the profits on the individual rows
- This is because the tiles reflect ALL OOEs, even those which are not product-related
- The rows reflect ONLY the OOEs related to the product
- The difference in profit will be the OOEs which are not product-related
- Net Profit
- The net profit generated by the sales of this product during the selected period
- Sales Rank (BSR)
- The latest sales rank for the product
- Buy Box Price
- The current offer price as detected by SellerLegend when last updating products.
Hidden Columns
- Learn how to hide/unhide columns
- The following columns are hidden but can be added to the Orders view at any time:
- Title
- Account Title
- SKU
- FNSKU
- Brand
Related Posts
- How Do I Define An Internal Name For A Product?
- How Do I Assign Tags To Products?
- Learn how to Define And Assign Product Groups
- What is Period-Based Cost Of Goods?
- How Do I Define A Cost Of Goods For A Product?
- How Do I Know Which Dates To Use In COGS Periods When New Stock Arrives?
- How Does SellerLegend Determine The COGS For An Order?
- Cost Of Goods (COGS) Screen
- How Do I Reveal/Hide Additional Screen Columns?