
How To Get Here ?
- Click on any instance of a Product Image on any screen system-wide
- OR In Products List, click Actions -> Edit Product, and select the Statistics Tab.
- The Modals are NOT accessible from the menu
What is it for ?
- Used for a quick view of Product Performance
- Does not require any screen transition, so it is faster than switching to the Product Dashboard
- Obviates the need to select the product in the Product Dashboard
- Easily accessible through many screens with just one single click
- Provides fast access to all product settings as well as to the Product Dashboard and to the Product Statistics for a singular product
Tips And Tricks!
- You can quickly see product performance of a product on an order from the Orders Screen, just click on any product image of any order
- Modals are just popups on top of the screen containing the image you clicked on. Either hit the Escape key or click anywhere outside the modal to make the modal screen disappear and to take you back to your original screen.
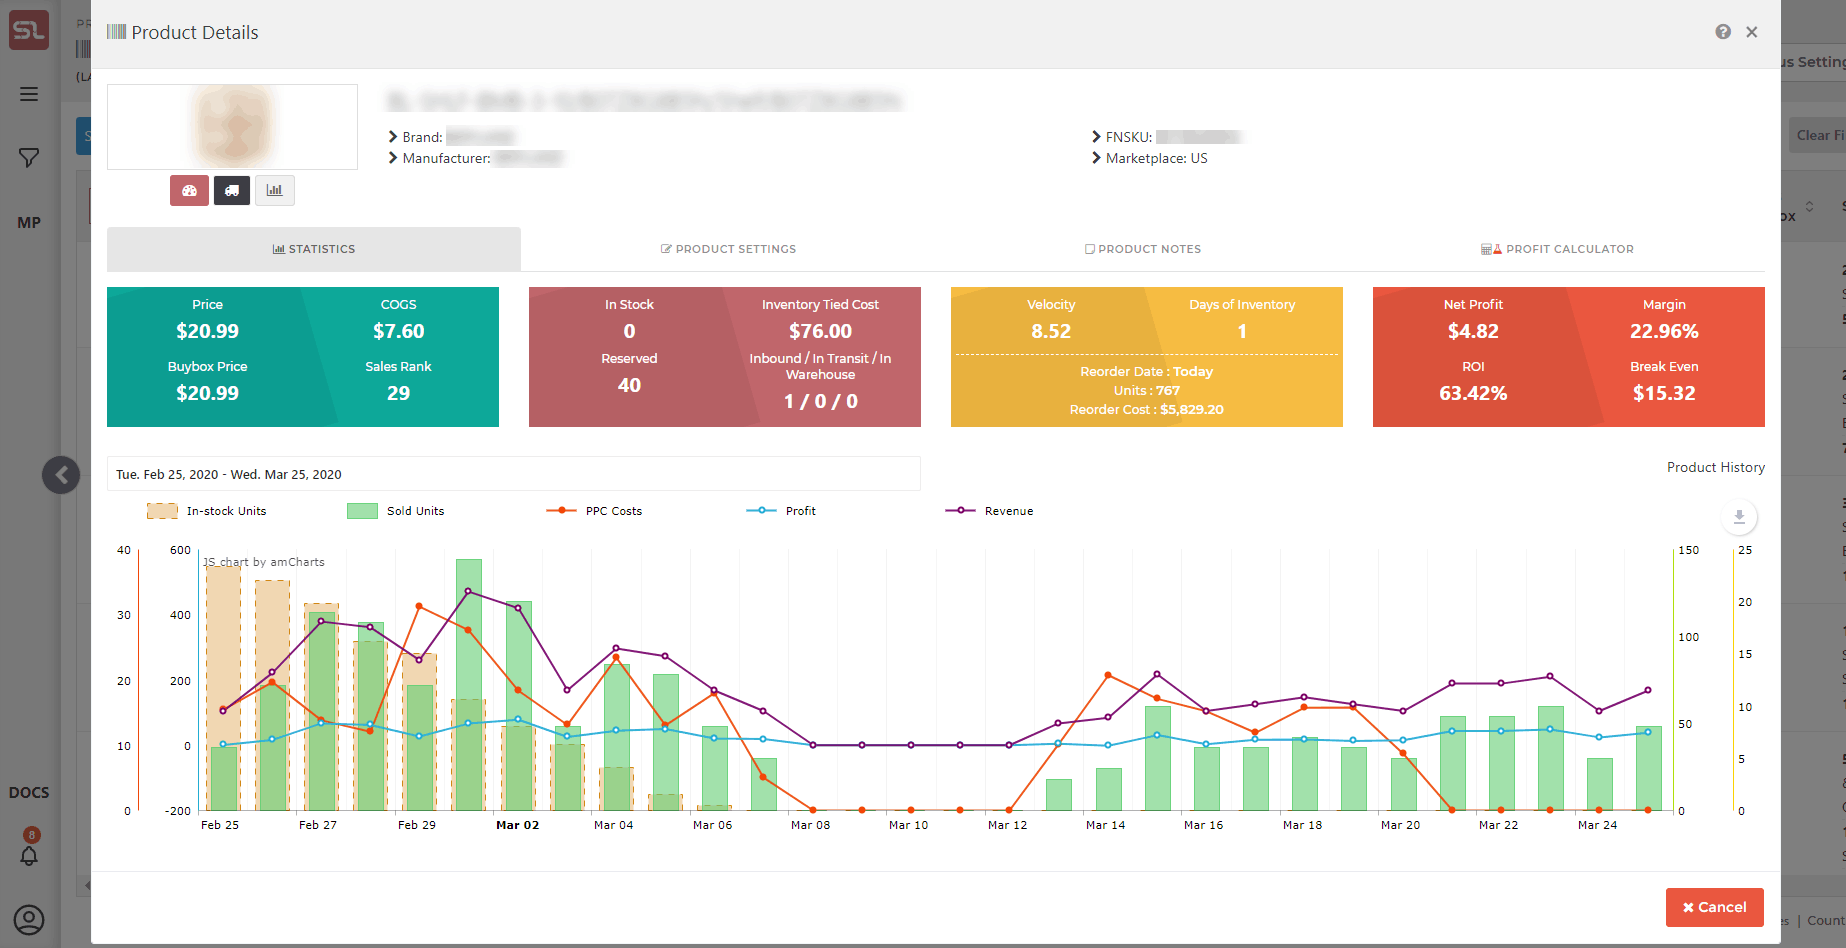
Screen Print
Content
(*) denotes features not yet implemented at the time of writing
- Header
- Product Image : the small thumbnail of the product image
- Product Identifiers : SKU / ASIN / Internal Name
- Product Manufacturer : Manufacture’s name
- FNSKU : Fulfilment Network SKU
- Marketplace
- Navigation
- Link to the Product Dashboard
- Click on the Dashboad icon under the product image to be taken to the Product Dashboard for the specific product
- Link to the Product Inventory Screen
- Click on the List icon under the product image to be taken to the Product Dashboard Screen for the specific product
- Link to the Product Statistics Screen
- Click on the Bar Chart icon under the product image to be taken to the Product Statistics Screen for the specific product
- Link to the Product Dashboard
- Statistics Tab
- Bear in mind that the tiles section is calculated on product data, not transactional data dictated by the date selector. Hence, the tiles will not change irrespective of the data range selected.
- Green Tile shows
- Current Listing Price
- Currently active Cost-Of-Goods Price
- The Latest Buybox Price
- The product’s Sales Rank
- Clicking anywhere on the green tile will take you to the Cost-Of-Goods Entry Screen for the product
- Blue Tile shows:
- Total Available Stock Quantity for the product
- Total Inventory Tied Cost for the product, in the currency of the product’s marketplace
- Number Of Reserved Units
- Number of Units Inbound and In Transit
- Clicking anywhere on the blue tile will take you to the Inventory Screen for the product
- Red Tile shows:
- 30 Day Sales Velocity / 7 Day Sales Velocity
- Number of Days of Inventory Left (Days to nil stock)
- If there are units In Transit, an information Icon appears. On hover, it will say how many units are in transit.
- Reorder Date : Latest date to reorder to avoid Out-Of-Stock condition
- Number Of Units to Order
- Cost of Reordering the ‘number of units to reorder’, expressed in the currency of the marketplace
- Clicking anywhere on the red tile other than the two velocities will take you to the Product Inventory Screen
- Clcking on either velocity will show the last 30 days or 7 days of orders respectively
- Yellow Tile shows, for one unit of the product:
- Net Profit
- Margin %
- ROI %
- Breakeven Price
- Notice that if there is no COGS for the product, these values will show N/A
- Product Sales and Stock History
- A graph showing daily, over a period of 30 days
- Daily Number of Units In Stock
- Daily Number of Units Sold
- Daily Sales Profit Amount expressed in the currency of the marketplace for the product
- Daily Sales Revenue Amount expressed in the currency of the marketplace for the product
- On hover, a popup will shoe the daily values of each data point
- As usual with any chart, clicking on the legend marker for a data series will clutter/de-clutter the data series on the chart
- A graph showing daily, over a period of 30 days
- Product Settings Tab
- Clicking on the Product Settings Tab will show the Inventory, Product Grouping and Miscellaneous Product Settings values
- These settings are explained in the Edit Product set of knowledge base articles listed in Related Posts