
How To Get Here ?
- From the Menu :
- Products –> Statistics
- Chose a tab :
- By Units (default),
- By Revenue,
- By Profit
What is it for ?
- Shows Sales By Units, Sales by Revenue and Sales by Profit statistics for all products which had sales in the past 30 days
- Shows sales velocity summary, stock positions, breakdown of Organic and Promo sales, Sales Trends and weekly statistics
- Each column conveniently links to the respective set of orders in the Orders screen or the Inventory screen. Just click the value in the column link!
Hints And Tips !
- Clicking on any blue number in the table will either take you to the orders screen and isolate the specific orders
- For example, clicking on the 30-day numbers will show you all the orders during the last 30 days.
- Likewise, clicking on the 30-day Promo units will show the promotion orders for the past 30 days.
- There are 3 tabs in this screen : By Units, By Revenue and By Profit
- By Units gives you the units value of the sales, By Revenue/By Profit gives you the monetary value of the sales
- Notice that the By Units trend and the By Revenue/By Profit trends may be show a different trend direction, as the trend is calculated based on different criteria. See below.
- A copy of this screen is attached to your daily email
- Learn how to specify the content of your daily email
Screen Print
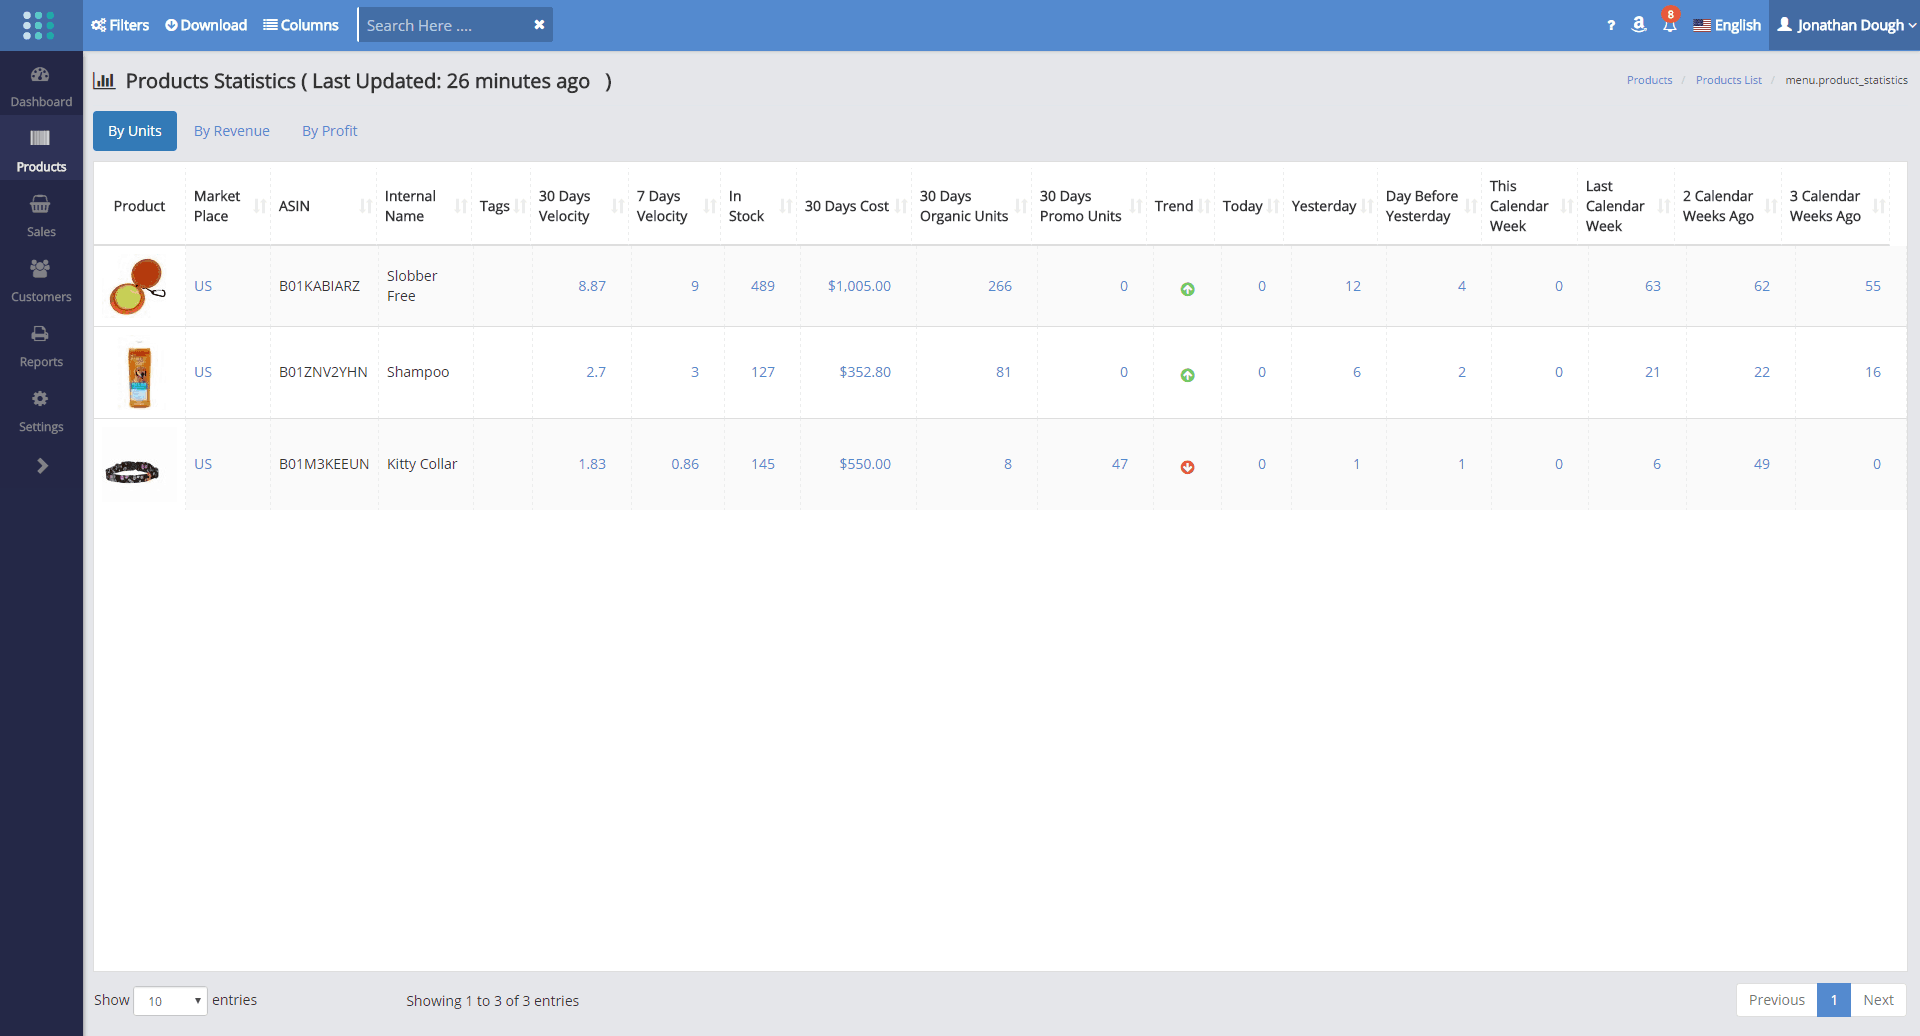
Content
(*) denotes features not yet implemented at the time of writing
- Product Image
- Small image of the product
- Clicking on the image will take you to the Product Dashboard for that product
- Product Title
- The Title of the product as it appears on your Amazon listing
- Marketplace
- The marketplace the product belongs to
- If the same product exists in more than one marketplace, then it will be repeated on a distinct row per each marketplace
- The marketplaces shown in the Product Statistics Screen is governed by the Marketplace Selector (the Amazon icon in the top right side of the task bar)
- ASIN
- The ASIN of the product
- Clicking on the ASIN will take you to your product’s listing on the Amazon catalog
- SellerLegend uses the short URL version of your ASIN to take you to the product listing. Clicking on the ASIN therefore does not adversely impact your conversion rates.
- Internal Name
- The Internal Name you have assigned to the product.
- Learn how to assign Internal Names to products
- Tags
- Any Tags you have assigned to the product pertaining to this order
- By using the Filters or the Omni-Search Bar, this allows you to quickly view all the products featuring the same Tag(s)
- Learn how to Assign Tags To Products
- 30 Days Velocity
- The average number of units sold per day over the last 30 days
- Does not take into consideration out-of-stock periods (under development)
- Clicking on the 30 Days Velocity value will take you to the Orders screen and show all the orders received during the last 30 days
- 7 Days Velocity
- The average number of units sold per day over the last 7 days
- Does not take into consideration out-of-stock periods (under development)
- Clicking on the 7 Days Velocity value will take you to the Orders screen and show the all the orders received during the last 7 days
- In Stock
- The number of units in stock for this product
- Clicking on the In Stock value will take you to the inventory screen for this product, where you can see more detail
- 30 Days Organic Units
- Number of Organic units sold in the past 30 days
- Clicking on the number of units will take you to the Organic units sold in the past 30 days in the Orders screen
- 30 Days Promo Units
- Number of Promo units sold in the past 30 days
- Clicking on the number of units will take you to the Promo units sold in the past 30 days in the Orders screen
- Trend
- For By Units
- Shows the Sales Trend, based on the 7 day and 30 day Sales Velocities
- If the 7 day velocity is higher than the 30 day velocity, the trend indicator will show a green UP arrow
- If the 7 day velocity is equal to the 30 day velocity, the trend indicator will show an amber NO CHANGE arrow
- If the 7 day velocity is lower than the 30 day velocity, the trend indicator will show a red DOWN arrow
- For By Revenue/Profit
- Shows the Sales Trend, based on the sales in 2 Calendar Weeks Ago Vs sales in 3 Calendar Weeks Ago
- If the sales in 2 Calendar Weeks Ago is higher than the sales in 3 Calendar Weeks Ago, the trend indicator will show a green UP arrow
- If the sales in 2 Calendar Weeks Ago is equal to the sales in 3 Calendar Weeks Ago, the trend indicator will show an amber NO CHANGE arrow
- If the sales in 2 Calendar Weeks Ago is lower than the sales in 3 Calendar Weeks Ago, the trend indicator will show a red DOWN arrow
- For By Units
- Today
- Number of units sold Today, OR
- Monetary value of Revenue/Profit for units sold today
- Clicking on the value in the column will take you to the all the units sold Today in the Orders screen
- Yesterday
- Number of units sold Yesterday, OR
- Monetary value of Revenue/Profit for units sold Yesterday
- Clicking on the value in the column will take you to the all the units sold Yesterday in the Orders screen
- Day Before Yesterday
- Number of units sold Day Before Yesterday, OR
- Monetary value of Revenue/Profit for units sold Day Before Yesterday
- Clicking on the value in the column will take you to the all the units sold Day Before Yesterday in the Orders screen
- This Calendar Week
- Number of units sold This Calendar Week, OR
- Monetary value of Revenue/Profit for units sold This Calendar Week
- Please note that This Calendar Week may be a partial week
- This is why the This Calendar Week is not considered suitable for the monetary sales trend evaluation
- Clicking on the value in the column will take you to the all the units sold This Calendar Week in the Orders screen
- Last Calendar Week
- Number of units sold Last Calendar Week, OR
- Monetary value of Revenue/Profit for units sold Last Calendar Week
- Please note that Last Calendar Week may still have Pending Orders
- This is why the Last Calendar Week is not considered suitable for the monetary sales trend evaluation
- Clicking on the value in the column will take you to the all the units sold Last Calendar Week in the Orders screen
- 2 Calendar Weeks Ago
- Number of units sold 2 Calendar Weeks Ago, OR
- Monetary value of Revenue/Profit for units sold 2 Calendar Weeks Ago
- Please note that, while still possible, 2 Calendar Weeks ago is unlikely to have Pending Orders left and will always be a full week
- This is why the 2 Calendar Weeks Ago is considered suitable for the monetary sales trend evaluation
- Clicking on the value in the column will take you to all the units sold 2 Calendar Weeks Ago in the Orders screen
- 3 Calendar Weeks Ago
- Number of units sold 3 Calendar Weeks Ago, OR
- Monetary value of Revenue/Profit for units sold 3 Calendar Weeks Ago
- Please note that, while still possible, 3 Calendar Weeks ago is unlikely to have Pending Orders Left and will always be a full week
- This is why the 3 Calendar Week is considered suitable for the monetary sales trend evaluation
- Clicking on the value in the column will take you to the all the units sold 3 Calendar Weeks Ago in the Orders screen
Other Hidden Columns
- Learn how to hide/unhide columns
- The following columns are hidden but can be added to the Orders view at any time:
- SKU