
How To Get Here?
- From the Main Menu
- Under Inventory –> Monthly Valuation
- Shows valuation details for all products
- Products, select the product and click on Actions drop-down –> See Monthly Valuation
- Shows only the valuation details for the selected product
What is it for?
- It is a “massaged” and improved version of your Seller Central Inventory Ledger report.
- Shows the End Of Month inventory position for all products by warehouse disposition
- Shows the End Of Month monetary value (Valuation) for each product by warehouse disposition
- For each product, it shows a list of all the Fulfillment Center IDS where there was inventory during the month.
- This may be useful to evaluate in which states you had Sales Tax Nexus for that month.
Hints And Tips!
- You can expect data for this report on the 3rd of every month for the previous month.
- We start pulling data for this report from the 1st of every month, but it can take up to 3 days to update.
- So as an example, you can expect the Monthly Valuation report for July by 3rd August.
- Amazon often delays this report, in which case we make a request for the report once every day until data is available or the request limit is reached.
- We make a total of 10 requests for the report.
- If no data is present by 15th, please consult seller support at Seller Central.
- By default, the Monthly Valuation is ordered in descending order by date, by ASIN and by Detailed Disposition (Sellable, Unsellable, Defective, Damaged …)
- It is up to the seller to only consider Sellable items for accounting purposes or all items, including damage, defective, etc … Aggregate the numbers by product to your specific accounting needs
- Use the omni-search box to locate the end of the month of interest to you (i.e.2017-02 would select February 2017 end of month positions for all products)
- Valuation history begins up to 18 months prior to your account’s onboarding, i.e., SellerLegend does not collect retrospective valuation data beyond 18 months.
- Right after onboarding, this screen will show no data, until the 6th day of the month following onboarding.
Screen Print
Content
(*) denotes features not yet implemented at the time of writing
- Product Image
- A small image of the product
- Clicking on the image will take you to the Product Dashboard for that product
- Marketplace
- The marketplace the product belongs to
- If the same product exists in more than one marketplace, then it will be repeated on a distinct row per each marketplace
- The marketplaces shown in the Products List screen is governed by the Marketplace Selector (the Amazon icon in the top right side of the taskbar)
- ASIN
- The ASIN of the product
- Clicking on the ASIN will take you to your product’s listing on the Amazon catalog
- SellerLegend uses the short URL version of your ASIN to take you to the product listing. Clicking on the ASIN, therefore, does not adversely impact your conversion rates.
- Internal Name
- The Internal Name you have assigned to the product.
- Learn how to assign Internal Names to products
- Tags
- Any Tags you have assigned to the product
- By using the Filters or the Omni-Search bar, this allows you to quickly view all the products featuring the same Tag(s)
- Learn how to Assign Tags To Products
- Month
- The year and month relating to the valuation data
- Detailed Disposition
- The disposition of your product (Customer Damaged, Defective, Sellable, Warehouse Damaged …)
- EOM Quantity
- The quantity of the product at the end of the month specified by Month and for the disposition specified by Detailed Disposition
- COGS (Cost Of Goods)
- The COGS for the product which was applicable on the last day of the month specified under Month
- If the COGS field is not empty and shows a blue hyperlink, clicking on the link will take you to the COGS Entry screen
- Learn how to Assign COGS To Products
- EOM Cogs
- The sum total of EOM Quantity multiplied by EOM COGS
- FC IDS
- Fulfillment Center Identifiers (Warehouses) where your product was stored any time during the month
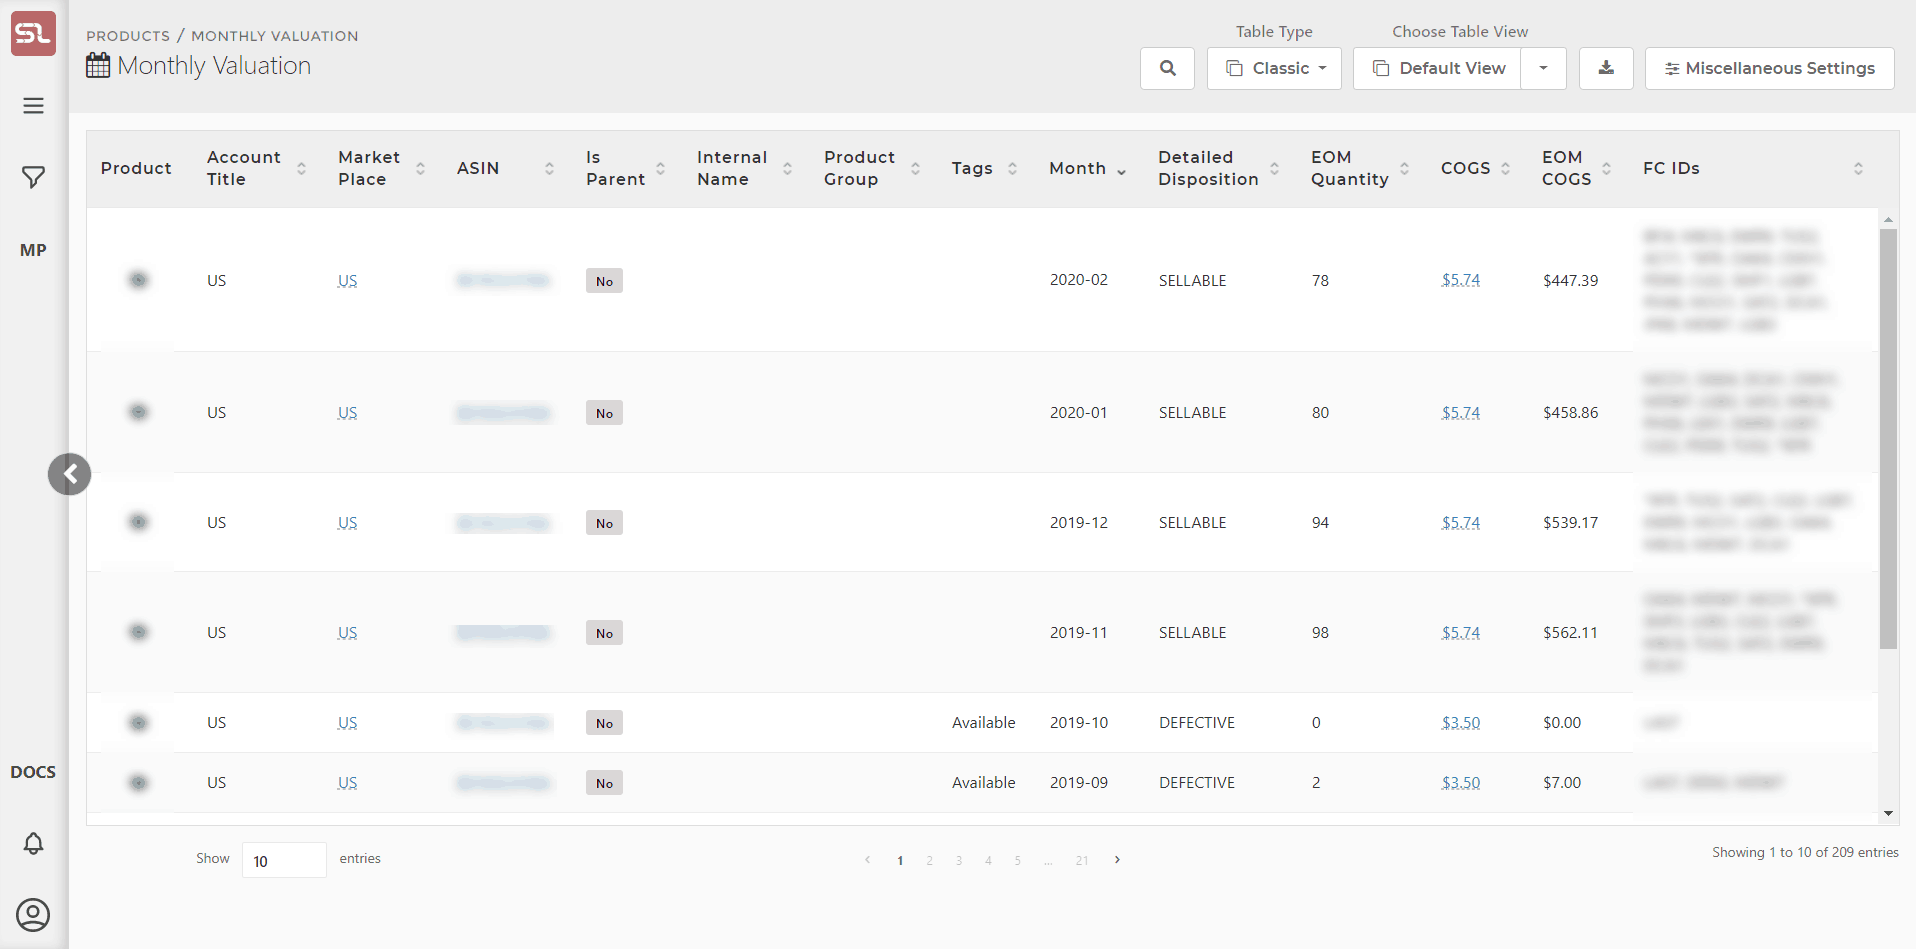
- Note that the EOM Quantity and Fulfillment Center IDS are loosely related.
- For example, the third row of the screen print above shows 94 units at the end of December across 12 Fulfillment Centers.
- However, bear in mind that at the end of the month some of those 12 FC may no longer have any stock left of that product
Other Hidden Columns
- Learn how to hide/unhide columns
- The following columns are hidden but can be added to the Orders view at any time:
- SKU