
How To Get Here?
- From the Left-hand Menu:
- Select the Dashboard Menu Entry
What is it for?
- This dashboard will show data relevant to either one marketplace in its native marketplace currency, or, in conjunction with Account Groups, will show aggregate data relevant to all of the marketplaces participating in the group
- If you have more than one Account/Marketplace/Group, clicking on the Marketplace Selector at the top left of the screen (under the heading “Select Marketplace/Group” will allow you to select the Account/Marketplace/Group of your choice
- The Marketplace Dashboard allows you to view the health of your marketplace accounts at a glance, marketplace by marketplace or in groups, for a specified date range which you can set by clicking on the Date Range Selector
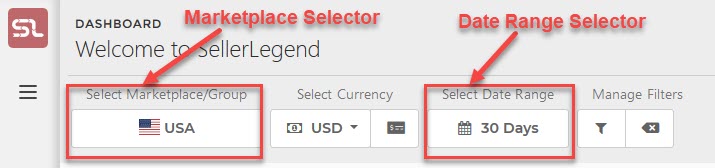
- The Marketplace Dashboard shows all the important Business Key Performance Indicators for a chosen date range, each KPI has its own individual widget on the Dashboard
Hints And Tips!
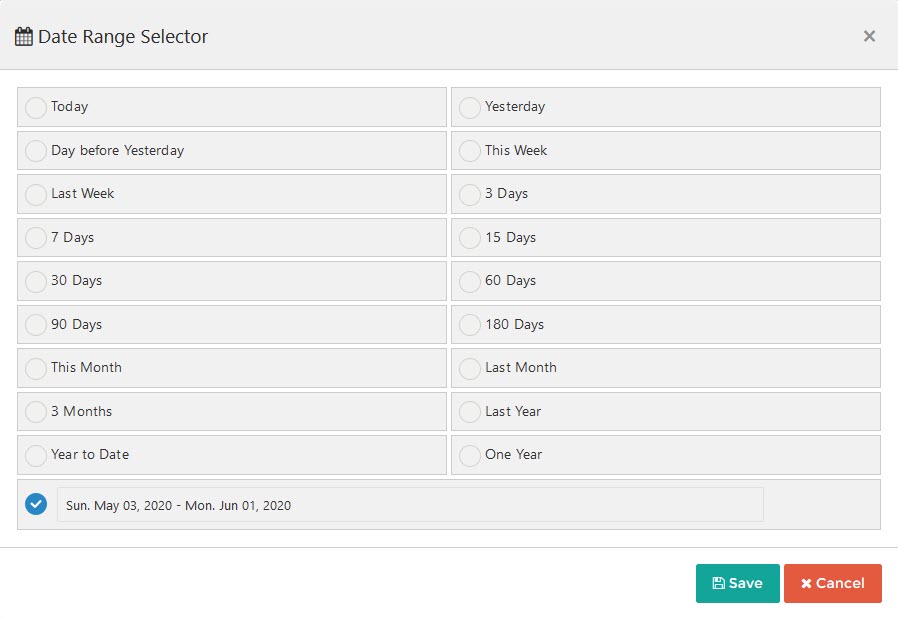
- Please note that there are FIVE date-selectors on the Marketplace dashboard
- One at the very top left of the screen, under the label “Select Date Range”, in a button with a calendar icon (see depiction above).
- This calendar governs the time period for most widgets on the dashboard, EXCEPT the four colored tiles
- This calendar also governs the time period shown on the main Sales History bar chart
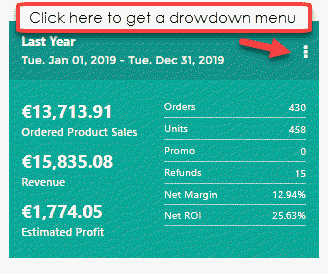
- Four other date selectors, one in each of the colored tiles
- The four date-selectors can be revealed by clicking on three dots icon at the top right of each individual tile and selecting the drop down menu item “Modify Date Range”
- These four individual date-selectors only affect the specific tiles they are attached to.
- One at the very top left of the screen, under the label “Select Date Range”, in a button with a calendar icon (see depiction above).
- Please also note that, when using date ranges, the Sales History bar chart does not include a bar for Today and that any colored tile showing a date range does not include today either
- So if a tile has, for example, a date range set for 30 days, it means 30 days starting yesterday.
- That is because unless it is 11:59:59, Today represents only a part of a day
- This does not mean that you cannot see today’s sales. When using selecting a single day in the date selector, you will see that day’s data, whether it is a complete day or not.
Screen Print
Content
(*) denotes features not yet implemented at the time of writing
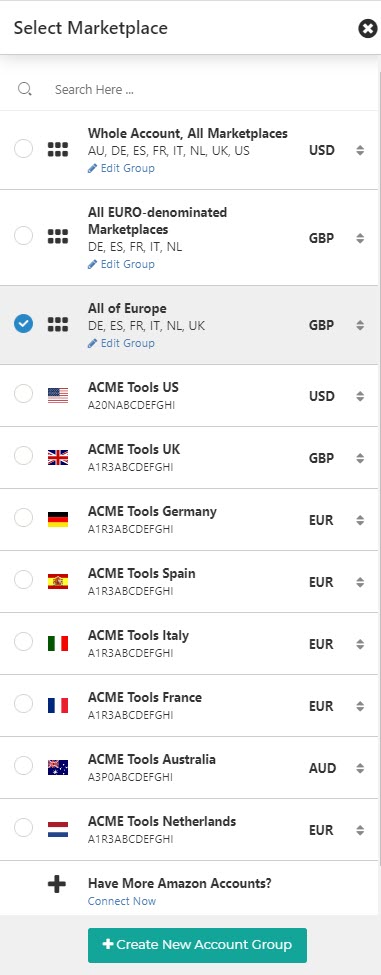
- Dashboard Marketplace Selector Panel
- When clicking on the marketplace selector, the following panel will appear
-
- Use this panel to select which Marketplace or Group to show on the Dashboard
- The Dashboard Marketplace Selector will be absent if you only have one Marketplace
- As a reminder, you can learn about selecting/switching Marketplaces or Groups here
- Tiled Key Performance Indicators Boards
-
- Four tiled Key Performance Indicators boards (four by default – additional tiles can be added at will)
- Each tile can be set to represent a different time period, independent from the timeframe set for the Marketplace Dashboard as a whole
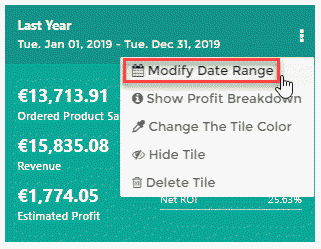
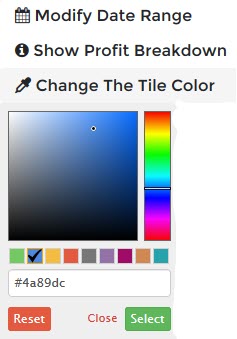
- Click on the three dots in the top right corner of the tile to open a drop-down menu. You can then:
- Choose to modify the timeframe to set the date range specific to the tile
-
-
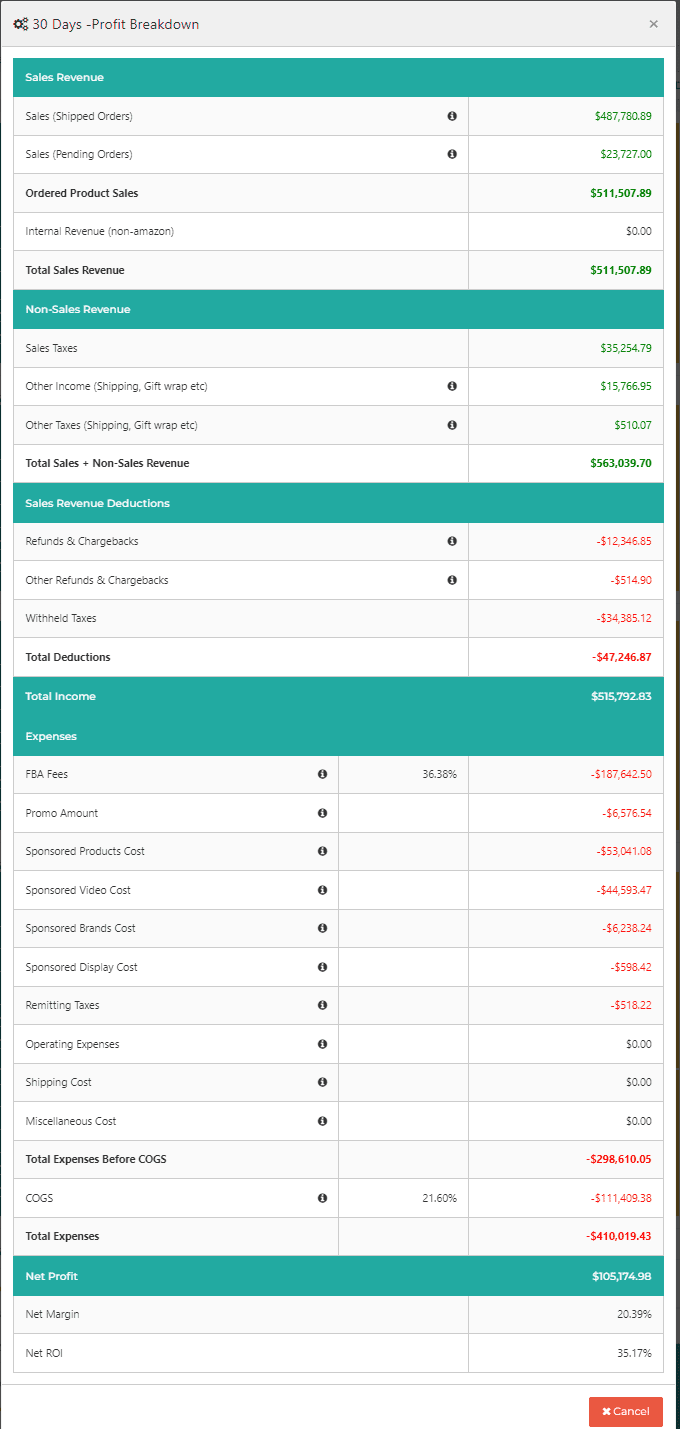
- Show the Profit Breakdown of the tile
-
-
-
- Change the Tile Color
-
-
-
- Or Hide/Show the individual tile
-
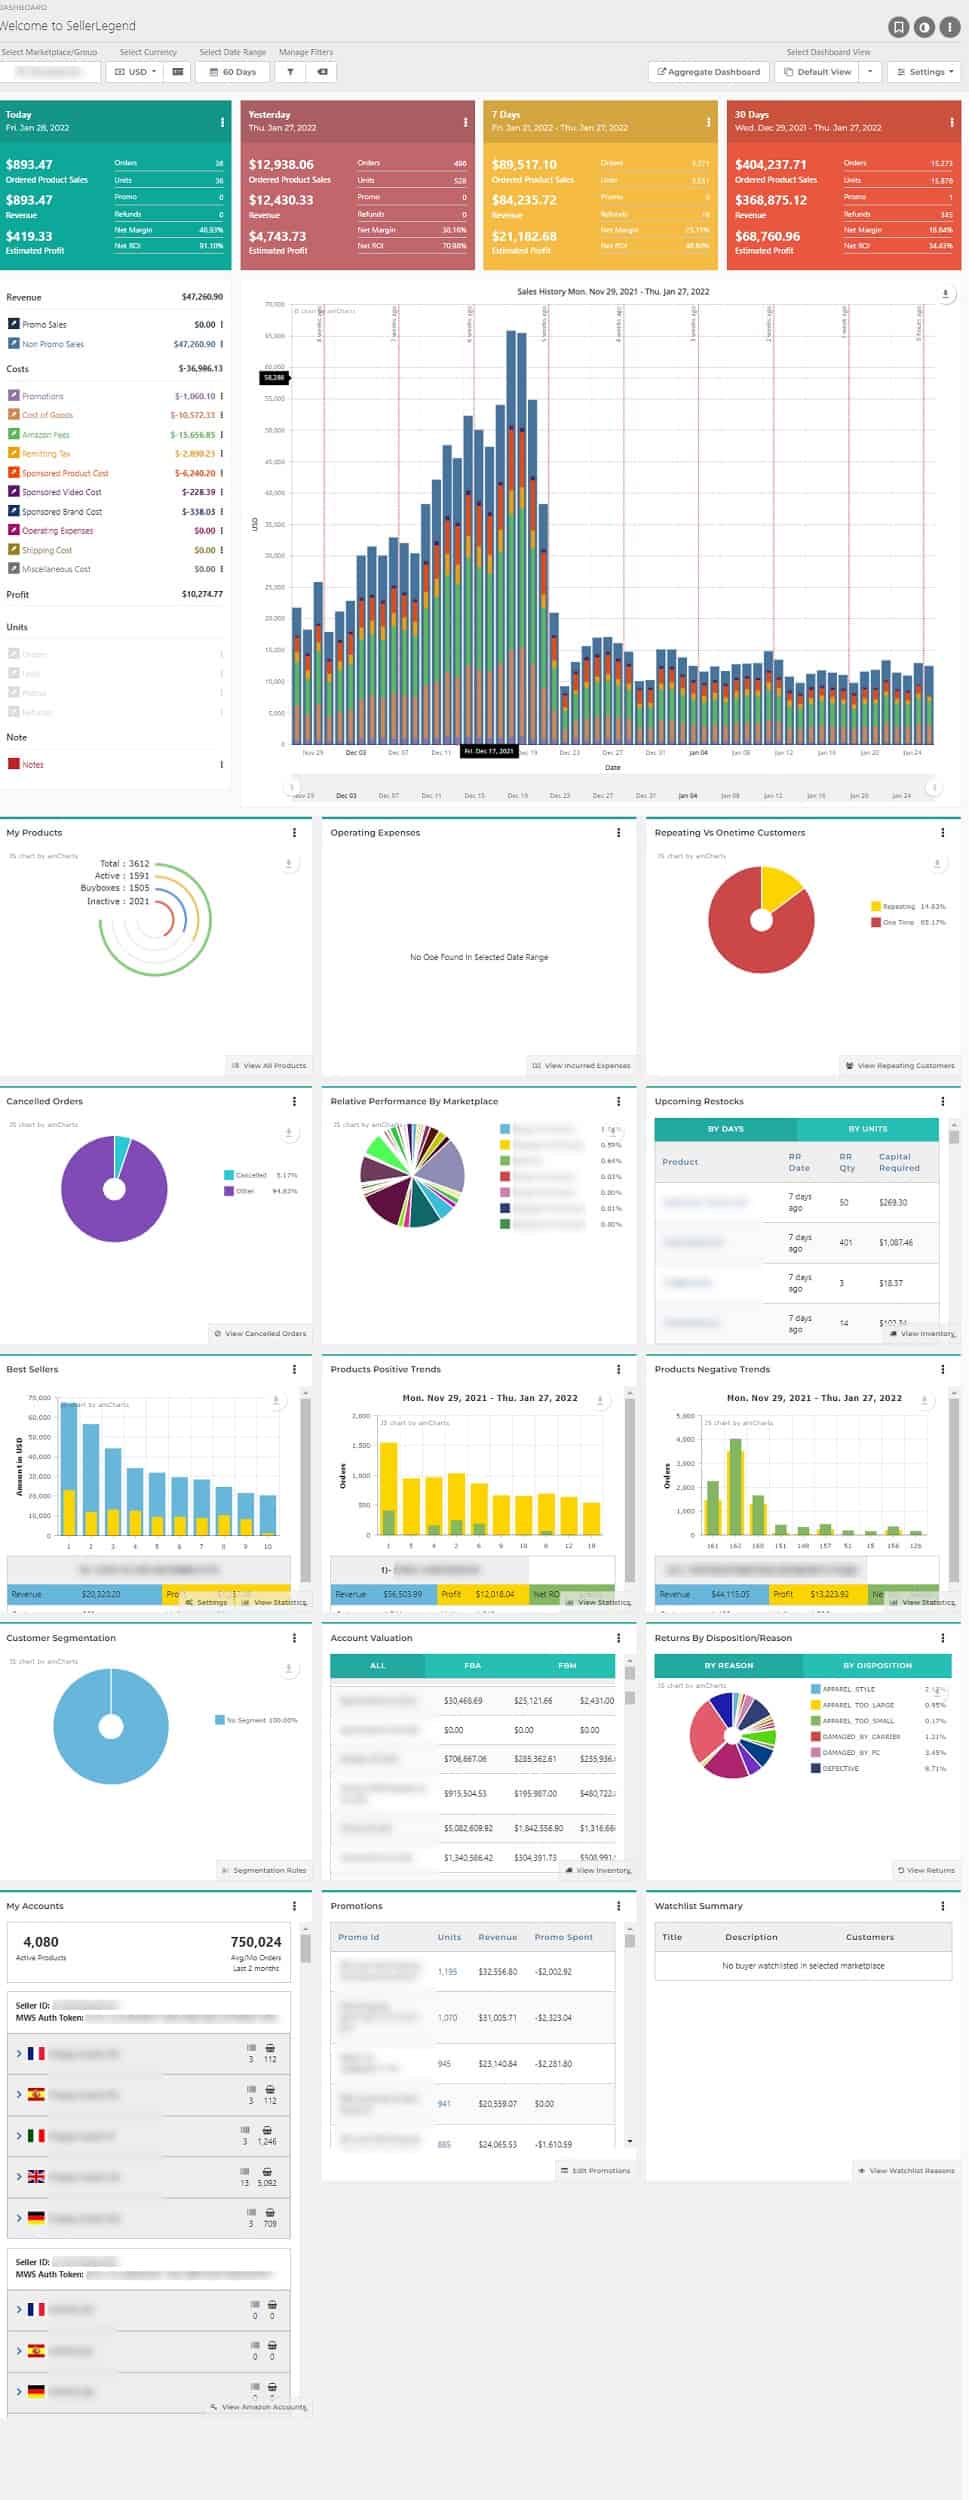
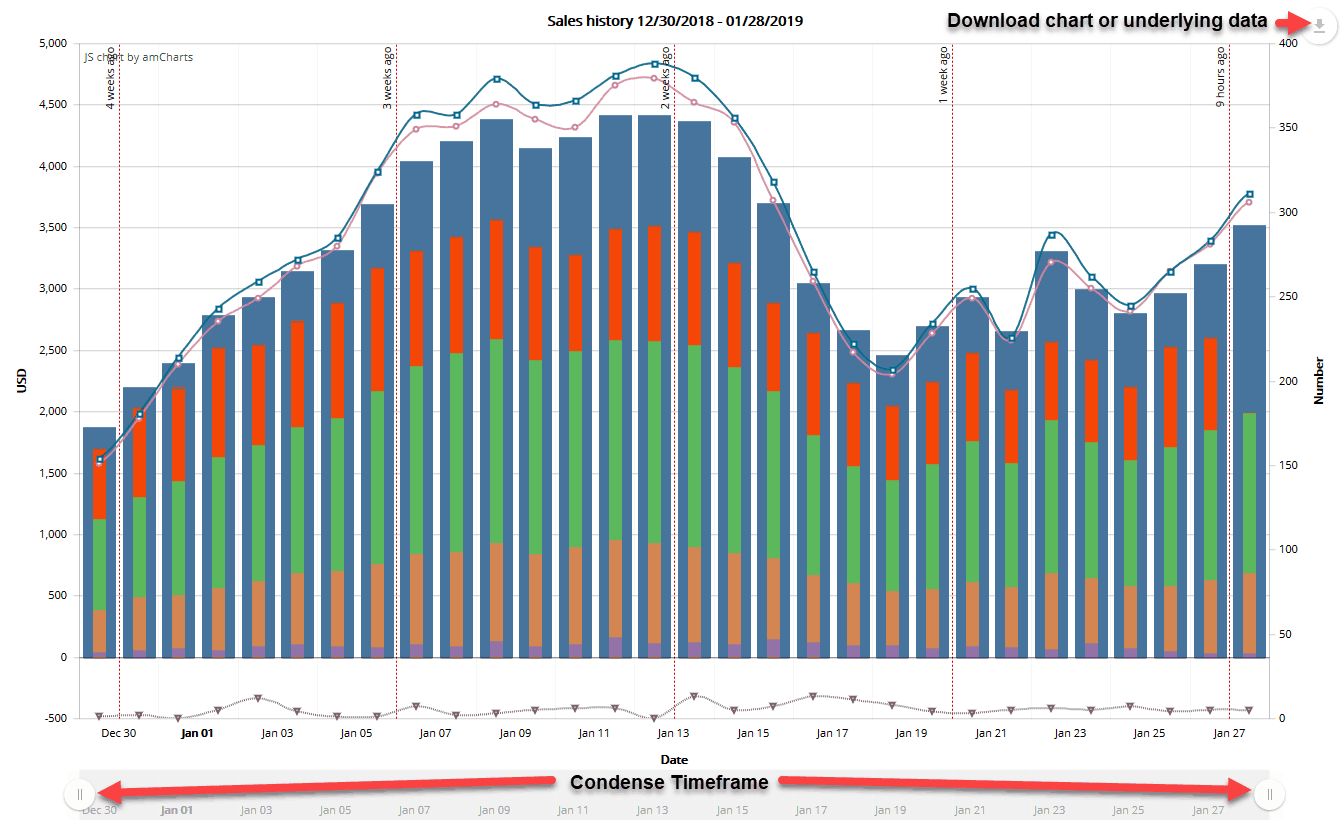
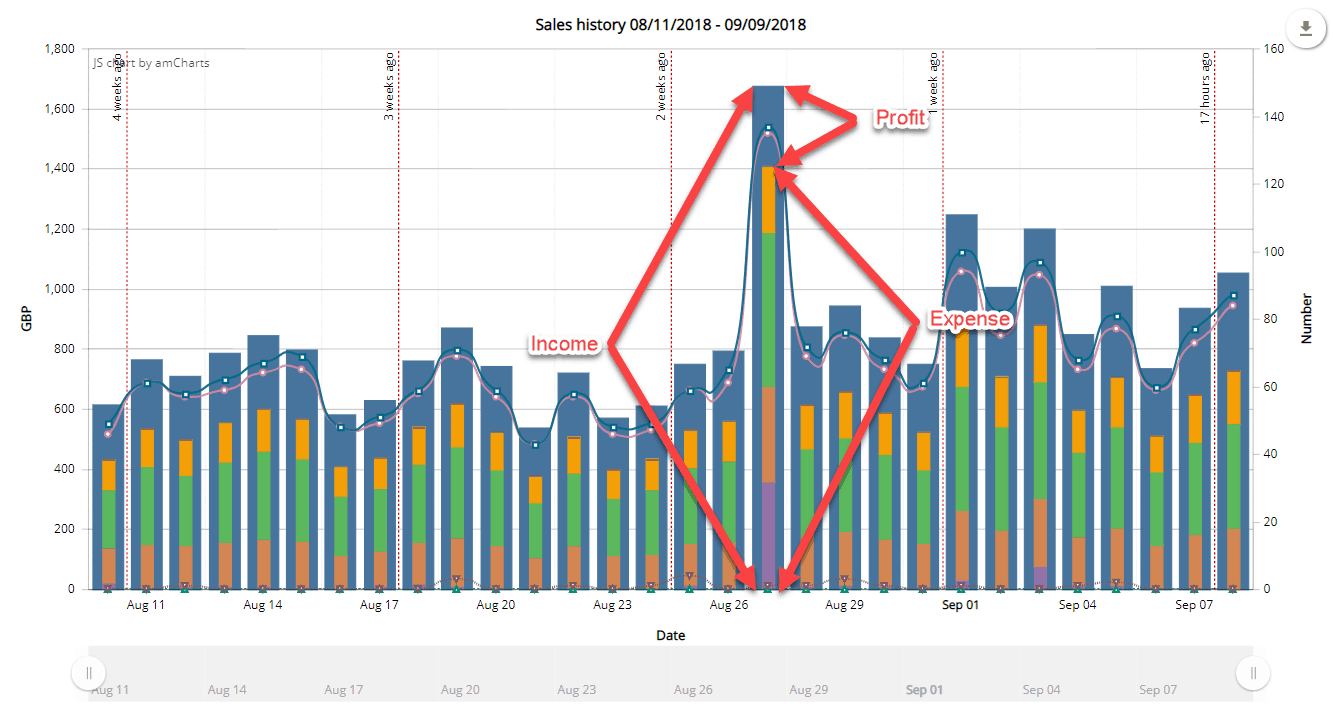
- The Sales History Bar Chart
-
- A stacked bar chart depicting the date range period set by the overall date selector button at the top right of the screen (in the screen title bar)
- Each bar in the chart represents one day
- The thicker stacked bars represent the Sales Revenue.
- The Sales Revenue bar in the chart is a stacked representation of Promo Sales + Non Promo Sales Revenue, each with a distinct color
- The thinner stacked bars represent the Costs
- The Costs bar in the chart is a stacked representation of Promotions + COGS + Fees + Taxes + PPC Costs + Operating Expenses, each with a distinct color
- The thicker blue bar represents Income, the thinner bars inside the blue bar represents Expenses. The profit is the portion of the blue Revenue bar which does not have any Costs inside it.
-
- Like with any chart in SellerLegend, the image of the chart or the underlying data of the chart can be downloaded by clicking on the transparent download button at the top right of the chart.
- The Sales History Chart Legend
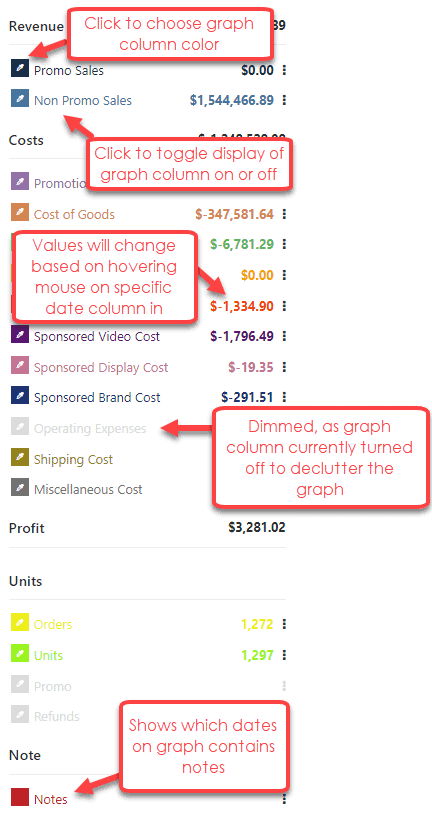
-
- A dynamic chart legend at the left of the chart which shows changing data points as you hover over the individual daily bars on the chart
- Shows the total sum of the date range values when the mouse is not resting on any bars in the chart area, or
- Shows the specific daily values for whichever bar you hover on in the chart area
- For each day (bar), there are three summary data series, one each for:
- Revenue Summary, broken down into:
- Promo Sales Revenue and
- Non Promo Sales Revenue
- Costs Summary, broken down into:
- Promotions
- The negative value of promotion revenue, i.e. how much was given away by the promotions
- Cost Of Goods
- The cost incurred to procure the goods sold during that day/period
- Right after onboarding, this value will be zero, until you have entered the COGS for each product sold
- Learn how to enter and manage Cost Of Goods
- Amazon Fees
- The sum of all the Order Related Amazon fees (Fulfillment and Referral fees)
- Please note the Non-Order Related Amazon fees (for ex. Inbound Transportation Fees, Long Term Storage Fees … ) are not included, as these are Operating Expenses and not sale fees.
- Remitting Tax
- Currently only includes Europe VAT or US Sales Tax
- For Europe marketplaces, right after onboarding, this value will be zero, until you have entered the VAT rules for the Marketplace and/or Products
- Learn how to define and manage VAT
- Sponsored Product Cost
- The sum of the daily Sponsored Product Cost for all the products sold during a day/period
- Right after onboarding, this value will be zero or very low, as SellerLegend has not yet accumulated any PPC Costs history
- Learn about the PPC Cost Summary Per Product Screen
- Sponsored Video Cost
- The sum of the daily Sponsored Video Cost for all the products sold during a day/period
- Right after onboarding, this value will be zero or very low, as SellerLegend has not yet accumulated any PPC Costs history
- Sponsored Brand Cost
- The sum of the daily Sponsored Brand Cost for all the products sold during a day/period
- Right after onboarding, this value will be zero or very low, as SellerLegend has not yet accumulated any PPC Costs history
- Operating expenses
- All the operating expenses incurred by the business on a day to day basis
- Right after onboarding, this value will be zero, until you have defined your one-time and recurring expenses
- Learn how to enter and manage Other Operating Expenses
- Shipping Costs
- This relates to FBM (not FBA) shipping costs which you have manually entered via bulk shipping costs upload
- Miscellaneous Costs
- This relates to FBM (not FBA) miscellaneous costs which you have manually entered via bulk miscellaneous costs upload
- Promotions
- Units Summary, broken down into:
- Number Of Orders received per day/period
- Number Of Non Promo Units sold per day/period
- Number Of Promotional Units sold per day/period
- Number Of Refunds Received per day/period
- Revenue Summary, broken down into:
- Managing the Sales Chart Legend and Graph
- To de-clutter the chart, the Units markers are not shown by default
- You can show any of the units markers by clicking on the grayed squares next to the units legends
- You can hide/reveal any of the fifteen data points on this chart by un-clicking/clicking on the square next to the data point you want to hide/reveal
- You can choose the color of any bar by clicking on the color picker symbol next to the bar’s legend
- A dynamic chart legend at the left of the chart which shows changing data points as you hover over the individual daily bars on the chart
- The Products Widget
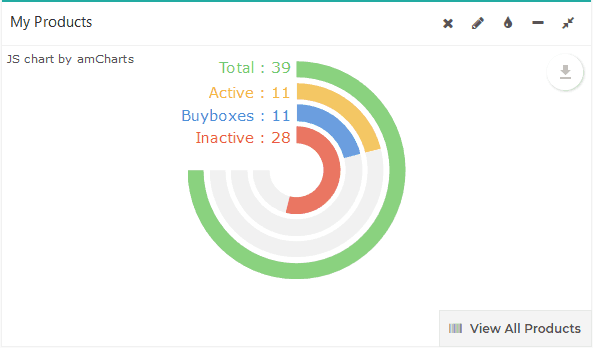
-
- A widget showing, for the selected marketplace:
- The total number of products,
- The number of active products
- The number of products holding the buy box
- The number of Inactive products
- Clicking on the View All Products link at the bottom of the widget will take you to Products->Products List in the menu
- This widget is updated every 8 hours
- This widget always shows the current status and is not sensitive to the Dashboard Date Selector
- A widget showing, for the selected marketplace:
-
- The Operating Expenses Widget
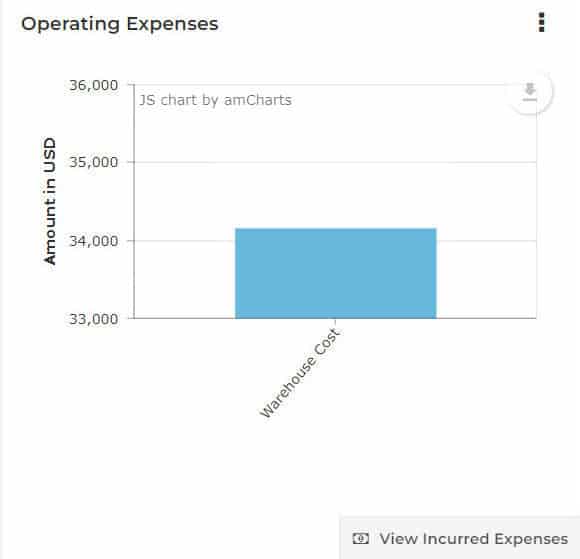
-
- A widget showing, for the selected marketplace:
- The types of operating expenses incurred
- The value of each type of expense incurred
- Clicking on the “View Incurred Expenses” button takes you to the Incurred Expenses screen.
- A widget showing, for the selected marketplace:
-
- The Top 10 Best Sellers Widget
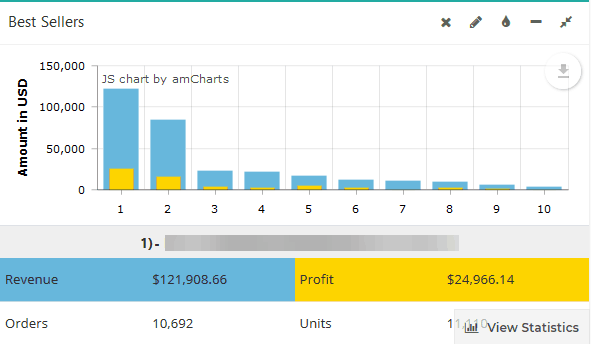
-
- A widget showing, for the selected marketplace, a bar graph where each bar shows the relative performance of the top 10 best selling products for the chosen period, in descending order of revenue
- Hovering on each of the bars will show the following for each product
- Internal Name
- SKU
- ASIN
- Revenue
- Profit
- Units
- Orders
- Clicking on the View Statistics link at the bottom of the widget will take you to Sales->Sales Statistics in the menu
- Please note that this widget will respect whatever date range you have specified for the Dashboard.
- If your dashboard date range is set for 30 days, the widget shows bestsellers over the past 30 days.
- If you have set the dashboard date range to Year To Date, then it will show the bestsellers since the beginning of the year.
- Products Positive Trends
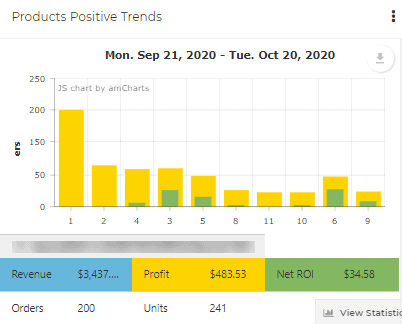
-
- A widget showing, for the selected marketplace, a bar graph that compares the orders and statistics of different date ranges.
- For example, if you have selected 1 week in the date range, the widget will compare the trend of this week with the previous week
- The green bar indicates Previous orders
- The yellow bar indicates current orders
- Hovering on each of the bars will show the following for each product
- SKU
- ASIN
- Revenue
- Orders
- Profit
- Units
- Net ROI
- Clicking on the View Statistics link at the bottom of the widget will take you to Sales->Sales Statistics in the menu
- Please note that this widget will respect whatever date range you have specified for the Dashboard.
- If your dashboard date range is set for 30 days, the widget shows a comparison over the past 30 days.
- If you have set the dashboard date range to Year To Date, then it will show the comparison since the beginning of the year.
- Products Negative Trends
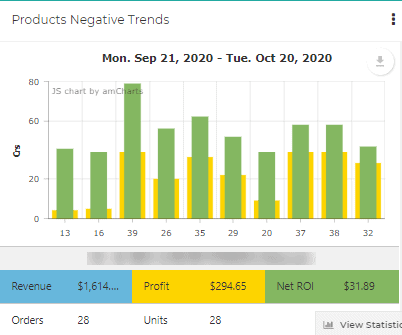
-
- A widget showing, for the selected marketplace, a bar graph that compares the orders and statistics of different date ranges.
- For example, if you have selected 1 week in the date range, the widget will compare the trend of this week with the previous week
- The green bar indicates Previous orders
- The yellow bar indicates current orders
- Hovering on each of the bars will show the following for each product
- SKU
- ASIN
- Revenue
- Orders
- Profit
- Units
- Net ROI
- Clicking on the View Statistics link at the bottom of the widget will take you to Sales->Sales Statistics in the menu
- Please note that this widget will respect whatever date range you have specified for the Dashboard.
- If your dashboard date range is set for 30 days, the widget shows comparison over the past 30 days.
- If you have set the dashboard date range to Year To Date, then it will show the comparison since the beginning of the year.
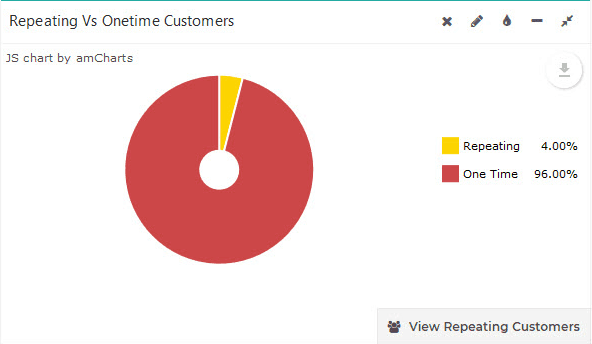
- The Repeating Vs One-Time Customers Widget
-
- A pie chart with two slices
- The Number and Percentage of Repeating Customers for the selected marketplace
- The Number and Percentage of One-Time Customers for the selected marketplace
- Clicking on the Customers link at the bottom of the widget will take you to Customers->Customers List in the menu
- This widget reports values for all the orders captured in your SellerLegend account, which is all orders received from 18 months prior to the date of onboarding into SellerLegend, and disregards the dashboard date settings
- Clicking on the View Repeating Customers list will take you to the Customers->Customers List screen and show you all the customers who have bought more than once from you
- A pie chart with two slices
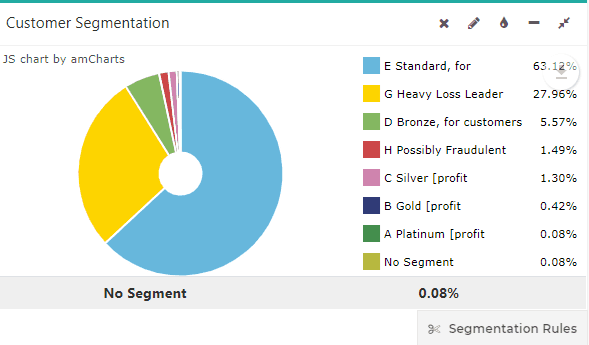
- The Customer Segmentation Widget
-
- Right after onboarding, this pie chart will only show a 100% slice
- You’ll need to define the settings for Customer Segmentation before this widget shows any relevant data
- Once the segmentation rules have been set, this widget shows the relative proportion of each customer segment for the marketplace
- Learn How To Perform Customer Segmentation
- Clicking on the Segmentation Rules link at the bottom of the widget will take you to Settings->Customer Segmentation in the menu
- This widget reports values
- for all the orders captured in your SellerLegend account, which is all orders received from 18 months prior to the date of onboarding into SellerLegend, and disregards the dashboard date settings
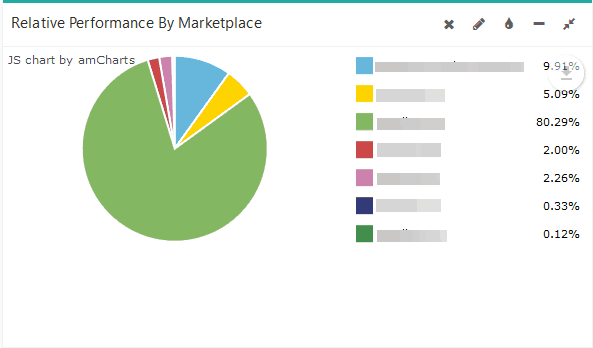
- The Relative Performance By Marketplace Widget
-
- If you only have one marketplace defined in SellerLegend, this widget will not appear
- A pie chart showing a pie slice ranked by units sold for each marketplace
- On hover, each slice shows a pop-up with the Account Name, Number of Units Sold, Revenue, and Profit during the selected time period
- Please note that Revenue and Profit figures are not normalized and show values in the currency of their respective marketplace
- This widget shows all marketplaces and disregards the dashboard marketplace settings
- The Promotions Widget
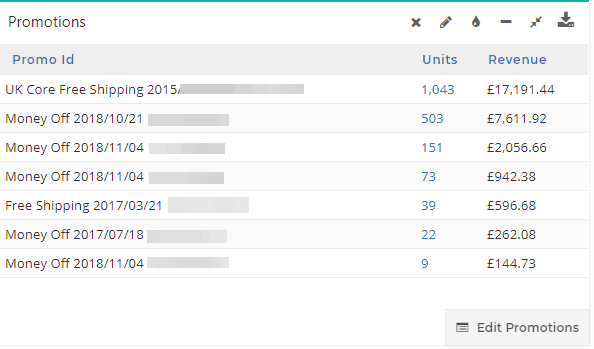
-
- Lists all the promotion codes used in Orders during the selected date range period
- Shows both user-defined and Amazon internal promo codes
- For each promo code, shows the number of instances the promo code was used during the selected date range period
- Clicking on any number in the Units column will take you to the Orders screen and show all the orders received during the specified date range period which used the promo code
- The widget features an Edit Promotions button at the bottom right of the widget.
- Clicking on the edit button will show the list of all the promo codes used, with a tick mark next to each promo code
- Un-ticking the mark next to a promo code in that list will hide the promo code from the list – The promo code will still appear on the Orders screen
- Likewise, ticking the mark of a hidden promo code will reveal that previously hidden promo code in the list
- A field next to the promo code description allows you to record a ‘friendly name’ for that promo code which will be used in the widget instead of the internal Amazon promo code description
- The My Accounts Widget
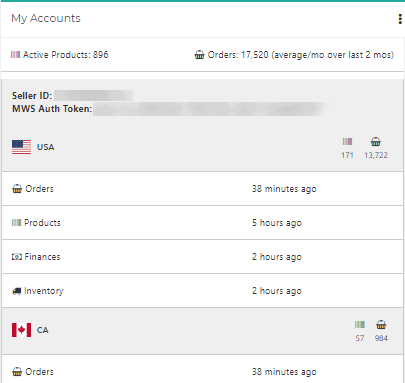
-
- This is a text widget which shows details about the individual accounts/marketplaces defined within SellerLegend, as well as the data ‘freshness’ of the data for each account/marketplace
- The widget shows, for each Amazon account/marketplace onboarded in the SellerLegend account
- The Account Title
- The Seller ID
- The MWS Authentication Token
- How long ago data was last downloaded for
- Orders (which updates every 30 minutes)
- Products (which updates every 8 hours)
- Financial Transactions (which updates every 30 minutes)
- Inventory Data (which updates every 4 hours)
- This widget shows all marketplaces and disregards the dashboard marketplace settings
- This widget also shows order and SKU volume information relevant to the SellerLegend account billing
- At the top of the widget, under the widget’s title, it reports on
- the number of SKUs across ALL marketplaces, as well as on
- the average number of orders over the past two months
- These order and SKU volumes can be compared to the subscription plans found at https://sellerlegend.com/pricing to determine the cost of the current membership plan
- At the top of the widget, under the widget’s title, it reports on
- When applicable, this widget will carry an alert about any marketplace for which SelerLegend has lost contact with Amazon for any reason and is unable to be synced
- Clicking on the link to View Amazon Accounts will take you to Settings->MWS Settings where you can add more Amazon Marketplaces to your SellerLegend account or edit the Marketplace Name for any Marketplace in SellerLegend
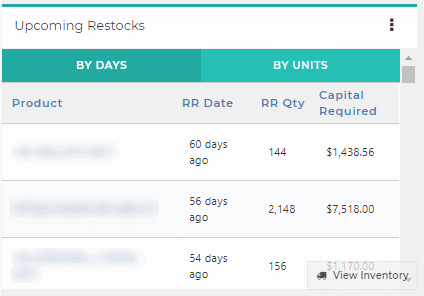
- The Upcoming Restocks Widget
-
- A recap of the products which will run out of stock based on a predefined set of conditions
- Product: Will show (in order of priority) Internal Name or ASIN or SKU, whichever is present
- Recommended Reorder Date: latest date at which to reorder to avoid an out-of-stock condition
- Recommended Reorder Quantity: Quantity to reorder to comply with Product Settings rules
- Capital Required: Recommended Reorder Quantity multiplied by current COGS for the product
- It is advisable to read the following knowledgebase articles to understand how to set-up this widget to maximum benefit:
- The Default Inventory Settings Screen, to understand how to customize default inventory settings which apply to all products
- The Edit Products Screen, to understand how to customize inventory settings specific to any individual product
- Whether a product appears in this list or not is controlled by the following Inventory Settings for the product
- Alert Days
- The product restock will only appear in the widget If
- The out-of-stock condition is to occur within the specified number of days or units in the future
- The out-of-stock condition has occurred within the specified number of days or units in the past
- The ‘days/units in the future’ rule allow the widget to only report on the most urgent restocks
- The ‘days/units in the past’ rule allow the widget to avoid reporting on products which you are likely wanting to ignore
- The product restock will only appear in the widget If
- Notify Stockout
- The product restock will only appear in the widget if the Notify Stockout tick mark is checked
- The Notify Stockout flag is ticked on all products by default. You need to unset the flag if you want to ignore restock notifications.
- This allows you to ignore restock warnings for products which are discontinued
- Alert Days
- Conditional Rules for Items To Appear In the Widget
- The widget will only report on products where the recommended reorder quantity is greater than 1
- This is to discard alerts for very slow-moving or abandoned products
- The number of products shown in the widget is limited to the first 100 which passes all the selection criteria.
- Product Notify Stock should be check-box must be ticked in Product Settings
- The product should not be hidden
- Reorder date should be > Alert Days ago
- Reorder units should be > Alert Units
- And days/units of inventory should also be less than or equal to alert days/units
- Viewing inventory for all products
- Clicking on the View Inventory at the bottom of the widget will take you to the Products Inventory Screen, where you can see inventory positions for all products
- A recap of the products which will run out of stock based on a predefined set of conditions
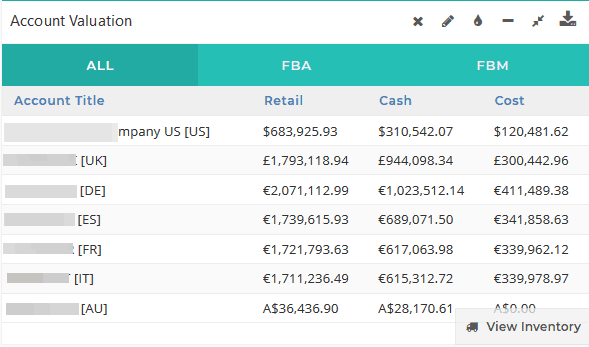
- The Account Valuation Widget
-
- Answers the question ‘How much is my Business worth ?’
- Shows ALL the Amazon Marketplaces/Accounts on-boarded onto SellerLegend
- Calculates how much the existing inventory costs, how much it can be sold for and how much benefit can be derived after selling it
- Shows the following valuations for each account:
- Retail Value
- What the stock is expected to sell for in total, at the current price
- Calculated as Total Inventory Quantity on Hand x (Current Selling Price (Today’s COGs) – Tax)
- Cash Value
- Best-case profit, at the current listing price and currently applicable COGS, excluding any future discounts or promotions, etc.
- Calculated as Total Inventory Quantity on Hand x (Revenue – Fees – COGS – Tax)
- Cost Value
- How much cash is currently tied up in inventory
- Calculated as Total Inventory Quantity on Hand x Current COGS
- Retail Value
- Please note
- The widget will show inaccurate results if you have not entered COGS for all products
- For European marketplaces, the values will be repeated for each marketplace if you have the same stock available for sale in all marketplaces
- This widget shows current (today) values and it disregards the dashboard calendar settings
- This widget shows all marketplaces and disregards the dashboard marketplace settings
- This widget gives current values for potential sales, and as such, it does not consider:
- Future promo sales
- Future COGS changes
- Future PPC costs
- The Returns By Disposition Breakdown Widget
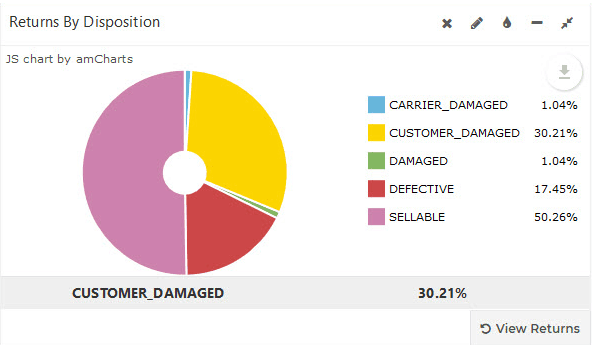
-
- This widget will show all returns received during the period set by the dashboard calendar and the selected marketplace
- The widget shows a pie chart with a slice for each distinct return disposition
- It shows the disposition name and the number of units returned for that disposition
- Clicking on the Returns link at the bottom of the widget will take you to Sales->Returns
- The Watchlist Summary Widget
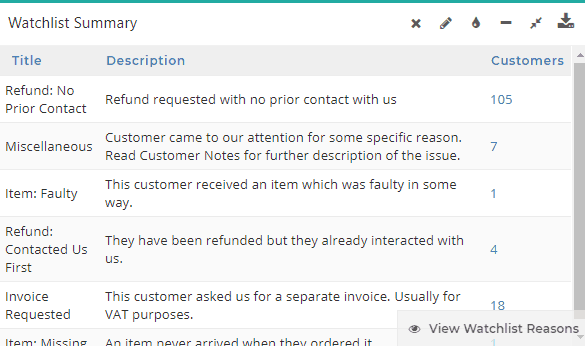
-
- This widget will show a breakdown of the number of customers watchlisted per reason
- The widget shows
- Title of the watchlist reason
- The verbose description of the watchlist reason
- The number of customers which have been watchlisted for that reason
- Clicking on the number of customers will take you to Customers->Customers List and will show all the customers who share the same watchlist reason
- Clicking on the Watchlist Reasons link at the bottom of the widget will take you to Settings->Watchlist Reasons screen where you can create custom watchlist reasons
- Note that this widget is not subjected to the Dashboard Calendar and shows all the customers irrespective of their last date of purchase
- The widget does respect the Dashboard Marketplace selector, though
The Cancelled Orders Widget
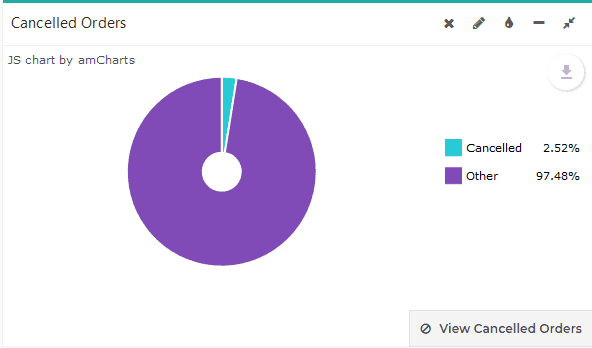
-
- A pie chart showing, for the selected marketplace, the proportion of Cancelled Orders Vs Total Orders
- Canceled orders are orders canceled by the buyer prior to dispatch by Amazon
- Clicking on the View Cancelled Orders link will take you to Sales->Orders with a filter on Order Status = Canceled
- This widget disregards the Dashboard’s selected date range and always shows the data since inception of the account
- The Long Term Storage Fees Forecast Widget (*)
- A Predictor of how much the LTSF will run to in February/September
- Based on current Stock Quantity On Hand based on a chosen sales velocity
- The Average Customer Cross Sell / Average Lifetime Value Widget (*)
- Average values per customer for Cross Sell and Lifetime Value
- See the Customer Cross Sell / Customer Lifetime Value Widget in the Customer Dashboard
Related Posts
- How Do I Organize Marketplace, Product and Customer Dashboards?
- How Do I Color-code Widgets On Dashboards?
- The Customer Segmentation Settings Screen
- What Is Period-Based Cost-Of-Goods?
- The Cost-Of-Goods Screen
- How Do I Define A Cost Of Goods For A Product?
- How Does SellerLegend Determine The COGS For An Order?
- How Do I Know Which Dates To Use In COGS Periods When New Stock Arrives?
- The Other Operating Expenses Settings Screen
- Defining One-Time And Recurring Expenses
- The Incurred Expenses Screen
- How Do I Define A Product’s VAT Rate?
- The Europe VAT Settings Screen