
How To Get Here?
- From the Menu:
- Products –> Dashboard
What is it for?
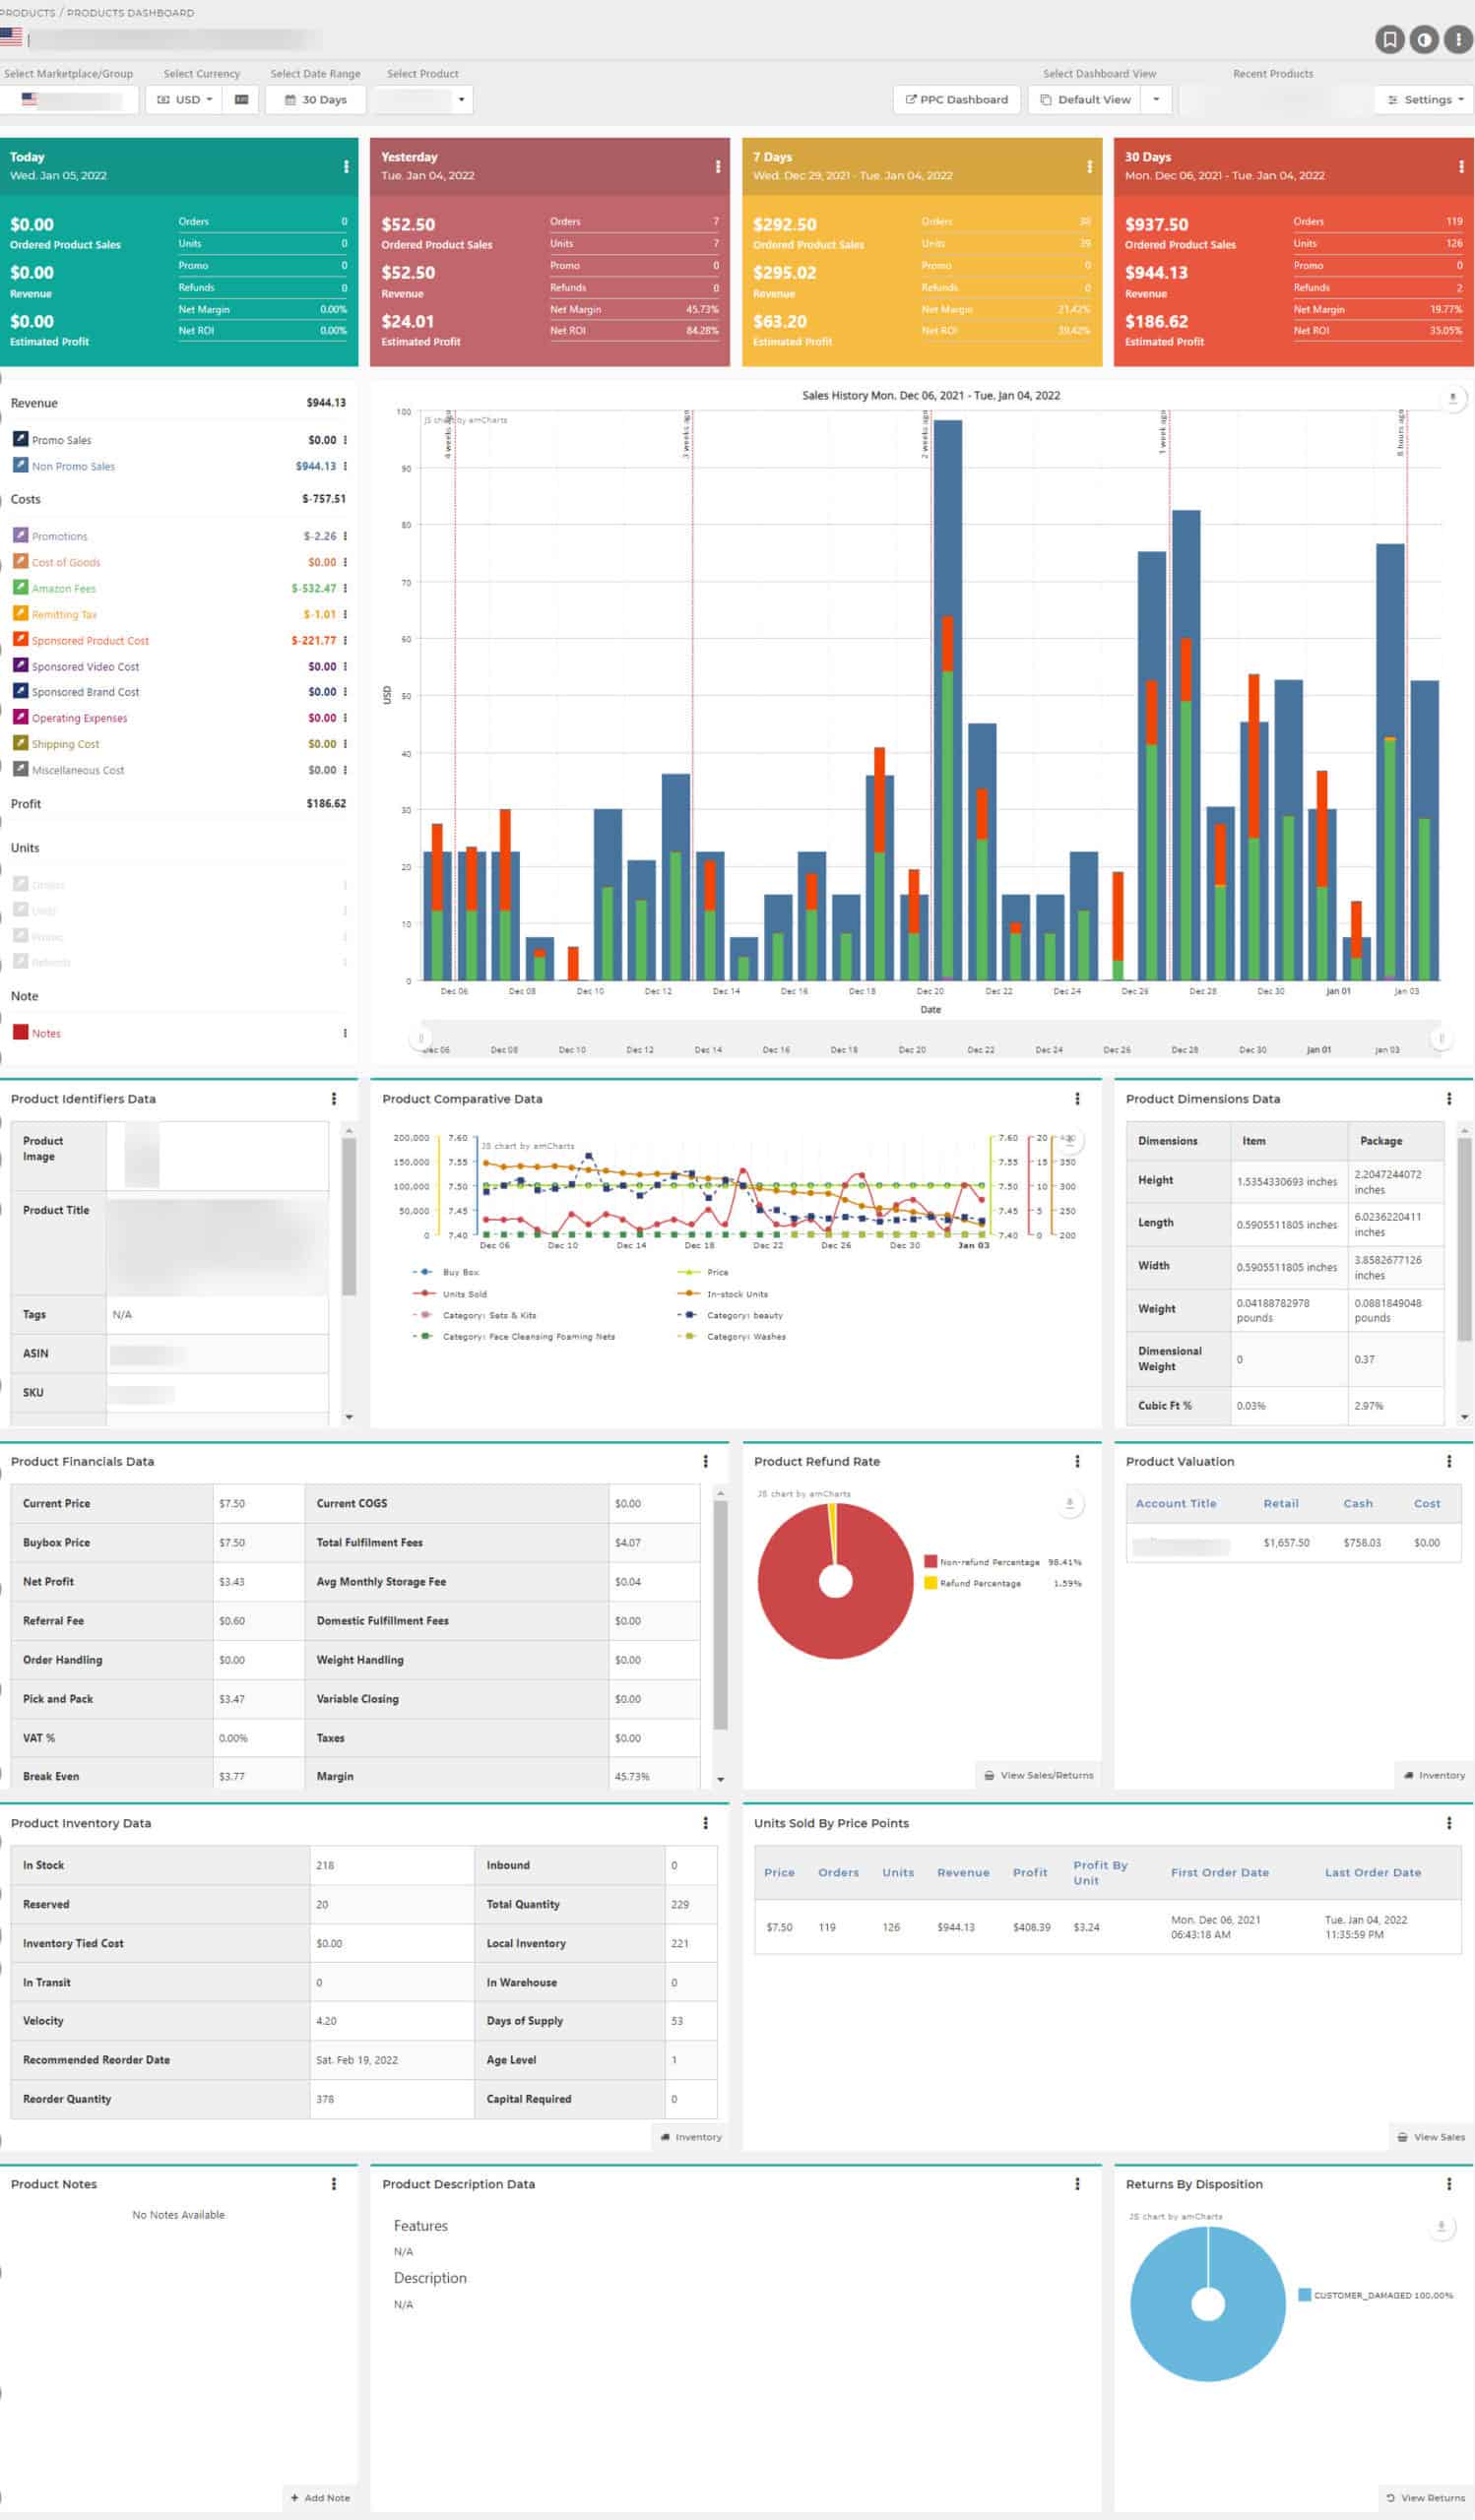
- This dashboard will show data relevant to one selected Product at a time
- If you have more than one Account/Marketplace, a Marketplace selector at the top right of the screen will allow you to select the Account/Marketplace of your choice
- Allows you to view the health of any product at a glance, product by product
- Shows all the important Business Key Performance Indicators for a product over a chosen date range
Hints And Tips!
- Please note that there are FIVE date-selectors on the Product dashboard
- One at the very top left of the screen, within the taskbar, in a button with a calendar icon.
- This calendar governs the time period for all widgets on the dashboard, EXCEPT the four tiled KPI boards
- This calendar also governs the time period shown on the main chart
- Four other date selectors, one in each of the tiled KPI boards.
- The 4 date-selectors can be revealed by clicking on the cogwheels at the top right of each individual tile.
- These date-selectors only affect the specific tiled board they are attached to.
- One at the very top left of the screen, within the taskbar, in a button with a calendar icon.
- Please also note that the chart does not include a bar for Today and that any tile showing a date in the future does not include today either
- So if a tile has, for example, a timeframe set for 30 days, it means 30 days starting yesterday.
- That is because unless it is 11:59:59, Today represents only a part of a day
- If you wish to go to the Sponsored Product Dashboard, you can go directly from this screen. Click on the PPC Dashboard button and it will take you to the Sponsored Product Dashboard screen.
Screen Print
Content
(*) denotes features not yet implemented at the time of writing
- Dashboard Marketplace Selector
- Use this drop-down box to select which Marketplace from which to select the product to show on the Dashboard
- You can only display one Product at a time
- The Dashboard Marketplace Selector will be absent if you only have one Marketplace
- The Product Selector
- The product selector allows a way to locate a product by typing any number of characters which can be found in either
- The ASIN
- The SKU
- The Product’s Internal name
- The product selector will provide a list of all the products which satisfy the criteria you typed against any of the 3 identifiers above
- This is to avoid having to select from a product dropdown menu with 1,000’s of products, as might be the case for Retail Arbitrageurs
- The product selector allows a way to locate a product by typing any number of characters which can be found in either
- Tiled Key Performance Indicators Boards
- Four tiled Key Performance Indicators boards
- Each tile can be set to represent a different time period, independent from the timeframe set for the Dashboard as a whole
- Click on the cogwheels on the top right of any tile to set the data range specific to the tile
- The available date ranges are
- Today
- Yesterday
- 30, 60, 90 Days
- This Month
- Last Month
- 3 Months
- Last Year
- Year To Date
- Custom Date Range
- The Sales History Chart
- A stacked bar chart depicting the date range period set by the overall calendar button at the top of the screen (in the taskbar)
- Please note that the overall calendar governs all the widgets on the screen, EXCEPT the tiled KPI indicators which have their own independent calendar per tile
- A dynamic chart legend at the left of the chart shows changing data points as you hover over the individual bars on the chart
- Each bar in the chart represents one day
- For each day (bar), there are three summary data series, one each for :
- Revenue Summary, broken down into :
- Promo Sales Revenue and
- Non Promo Sales Revenue
- Costs Summary, broken down into :
- Promotions
- The negative value of promotion revenue, i.e. how much was given away by the promotions
- Cost Of Goods
- The cost incurred to procure the goods sold during that day
- Right after onboarding, this value will be zero, until you have entered the COGS for each product sold
- Learn how to enter and manage Cost Of Goods
- Amazon Fees
- The sum of all the Order Related Amazon fees (Fulfillment and Referral fees)
- Please note the Non-Order Related Amazon fees (for ex. Inbound Transportation Fees, Long Term Storage Fees … ) are not included
- Taxes
- Currently only includes Europe VAT (not yet US Sales Tax)
- Right after onboarding, this value will be zero, until you have entered the VAT rules for the Marketplace and/or Products
- Learn how to define and manage VAT
- PPC Costs
- The sum of the daily PPC costs for all the products sold during a day/period
- Right after onboarding, this value will be zero or very low, as SellerLegend has not yet accumulated any PPC Costs history
- Learn about accumulating PPC Costs history
- Operating expenses
- All the operating expenses incurred by the business on a day to day basis
- Right after onboarding, this value will be zero, until you have defined your one-time and recurring expenses
- Learn how to enter and manage Other Operating Expenses
- Promotions
- Units, broken down into :
- Number Of Orders received per day/period
- Number Of Non promo Units sold per day/period
- Number Of Promotional Units sold per day/period
- Number Of Refunds Received per day/period
- Revenue Summary, broken down into :
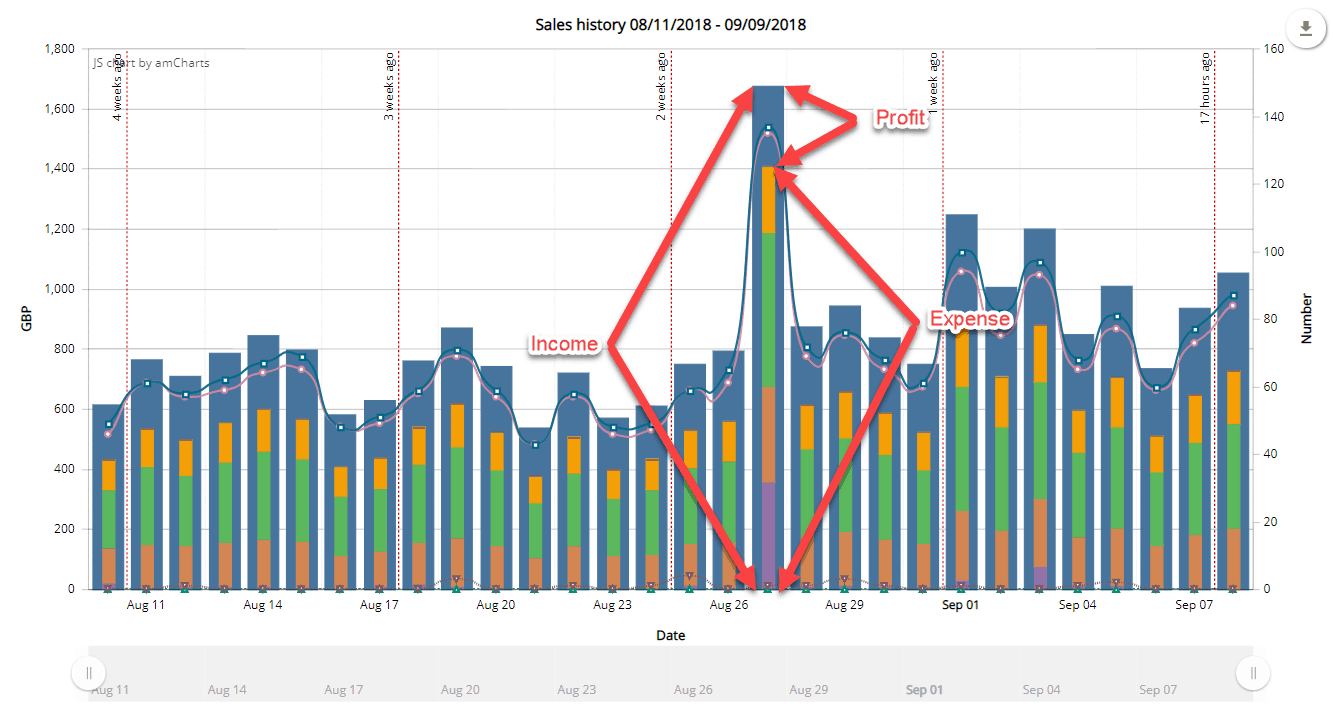
- The Revenue bar in the chart is a stacked representation of Promo Sales + Non Promo Sales, each with a distinct color
- The Costs bar in the chart is a stacked representation of Promotions + COGS + Fees + Taxes + PPC Costs + Operating Expenses each with a distinct color
- The Costs stacked bar is embedded in the Revenue stacked bar
- The blue bar represents Income, the thinner bar inside the blue bar represents Expenses. The profit is the portion of the blue Revenue bar which does not have any Costs inside it.
-
- To de-clutter the chart, the Units markers are not shown by default
- You can show any of the units data points by clicking on the greyed squares next to the units legends
- You can hide/reveal any of the twelve data points on this chart by un-clicking/clicking on the square next to the data point you want to hide/reveal
- The Product Identifiers Data Widget
- A text widget showing all available identifiers and characteristics of the product
- Product Title
- ASIN
- SKU
- FNSKU
- Internal Name
- Manufacturer
- Brand
- Product Group
- Product Tags
- A text widget showing all available identifiers and characteristics of the product
- The Product Comparative Data Widget
- A graph over the time frame selected by the calendar, plotting the following data series history
- Units Sold
- Price Histories
- Sales Rank
- Buy Box
- Right after onboarding, only the Units Sold history will be populated
- SellerLegend does not collect data retrospectively for Price Histories, Sales Rank and Buy box. These values will be collected every day going forward.
- Shows the minimum value of Sales Rank as the lower the BSR, the better.
- A graph over the time frame selected by the calendar, plotting the following data series history
- The Product Dimensions Data Widget
- A text widget showing dimensional data about the product, useful to calculate shipping costs
- Height
- Length
- Width
- Height
- Dimensional Weight
- Formula: (L * W * H) / 139
- Cubic Ft Percentage
- Formula: ((L * W * H) / 1728 ) * 100
- Girth + Length
- Product Size Tier
- A text widget showing dimensional data about the product, useful to calculate shipping costs
- The Product Refund Rate Widget
- A pie chart with two slices
- The percentage of non-refunded orders
- The percentage of refunded orders
- On hover over either slice, a popup will show the number of units refunded and number of units not refunded
- A pie chart with two slices
- The Product Financials Data
- Raw financial data values based on the product alone
- Important: The fee data (in Italics below) is for information only and is NOT used in calculations. Instead, SellerLegend uses the fee data Amazon sends alongside the order to calculate profits. The order data always reflects what Amazon charges you.
- Current Price
- Current COGS
- Total Fulfillment Fees (Referral + Order Handling + Pick & Pack + Weight Handling)
- Net Profit
- Avg Daily Storage Fee – It is total storage fee for all stock of an SKU / number of days.
e.g. If we have a fee of $100 for the last 3 months. it will be $100 / 90.= 1.11 - Order Handling Fee
- Weight Handling Fee
- Pick and Pack Fee
- Referral Fee
- Break Even Price Point (the price point at which you would make no profit or loss)
- Margin
- Return On Investment
- Average PPC value per day
- Right after onboarding, all but the Current Price will show N/A, as these values depend on COGS and no COGS is yet provided for the product
- Please note that the fee information is retrieved from the Amazon MWS Product API
- There are instances where the API shows incorrect information. This is an Amazon data issue, not a SellerLegend issue. If this is your case, you may want to query SellerCentral as to the cause of the inaccuracy.
- There are instances where the Amazon MWS Product API does not have any fee data at all for your product. In this case, most of the fields in the widget will show N/A. Again, this is a SellerCentral issue and not SellerLegend’s
- Please note that the fee data does not reflect the context of the product. For example, if your product is Small and Light registered, the fees will not reflect the reduced tariff based on product dimensions.
- Here are the formulae we use for the above KPI’s
- Referral Fee = Referral Percentage * Product Price;
- Product FBA Fee = Other FBA Fees + Referral Fee
- Costs = Product Cost + Product FBA Fee
- Total Cost Without Referral = Costs – Referral Fee
- Break Even = Total Cost Without Referral / (1 – Referral Percentage);
- Net Profit = Product Price – Costs
- Margin = (Net Profit / Product Price) * 100;
- ROI = (Net Profit / (Product FBA Fee + Product Cost)) * 100;
- Learn how to enter and manage Cost Of Goods
- The Units Sold By Price Points Widget
- A table with an entry by every distinct price the product was sold for
- The table is ordered in descending order of number of units sold (most units sold first)
- Table columns are
- Price
- Number of Orders received at that price for that product
- Number of Units sold at that price for that product
- Revenue collected on sales at that price for that product
- Profit generated from sales at that price for that product
- Average Profit By Unit
- First Order Date
- Last Order Date
- A table with an entry by every distinct price the product was sold for
- The Units Sold By COGS Widget
- A table with an entry for every distinct COGS the product was bought for
- COGS Amount
- Number of Orders sold at that COGS point
- Number of Units sold at that COGS point
- Revenue of orders sold at that COGS point
- Profit of orders sold at that COGS point
- First Order Date of orders sold at that COGS point
- Last Order Date of orders sold at that COGS point
- A table with an entry for every distinct COGS the product was bought for
- The Product PPC Cost History Widget
- A graph over the time frame selected by the calendar, plotting the PPC pricing history and showing the following data series
- Impressions
- Clicks
- CTR
- Average CPC
- Total Spend
- Right after onboarding, this chart will be empty, as SellerLegend has not yet begun collecting PPC history data
- A graph over the time frame selected by the calendar, plotting the PPC pricing history and showing the following data series
- Product Description Data Widget
- The product listing’s
- Product Bullet Points
- Product Description
- combined in one single data field for easy copy/paste
- The product listing’s
- The Product Description Data Widget
- A pie chart showing a pie slice for each marketplace
- On hover, each slice shows a pop-up with the Account Name, Number of Units Sold, Revenue and Profit during the selected time period
- The Promotions Widget
- Lists all the promotion codes used in the Product’s Orders during the selected date range period
- Shows both user-defined and Amazon internal promo codes
- For each promo code, shows the number of instances the promo code was used for the product during the selected date range period
- Clicking on any number in the Units column will take you to the Orders screen and show all the orders received during the specified data range period which used the promo code for the specific product
- The widget features an edit button at the bottom right of the widget.
- Clicking on the edit button will show the list of all the promo codes used, with a tick mark next to each promo code
- Un-ticking the mark next to a promo code in that list will hide the promo code from the list
- Likewise, ticking the mark of a hidden promo code will reveal that previously hidden promo code in the list
- A field next to the promo code description allows you to record a ‘friendly name’ for that promo code which will be used in the widget instead of the internal Amazon promo code description (*)
- The Listing History Before/After Image Widget
- A comparative listing history, showing a before and after image of the product listing and the differences
- Right after onboarding, this widget will only have the current version of the product listing, until the next listing change when SellerLegend will start gathering listing history
- The COGS History Widget
- Shown in reverse chronological order, the history of the COGS for this product. Shows a list of the following data
- Start Date
- End Date
- COGS value applicable between the above 2 dates
- Number of units sold between the above 2 dates
- Shown in reverse chronological order, the history of the COGS for this product. Shows a list of the following data
- The Categories And Sales Rank Widget
- A list of all the Categories and Sub Categories the product belongs to with the BSR for each cat/sub cat
- Sales Rank
- Category
- A list of all the Categories and Sub Categories the product belongs to with the BSR for each cat/sub cat
- The Segmentation (For Product) Widget
- A pie chart which plots the distinct customer segmentation criteria for the product
- Shows all segments defined in Customer Segmentation
- Shows the percentages by segment
- Learn how to define Customer Segments
- A pie chart which plots the distinct customer segmentation criteria for the product
- The Repeating Vs Onetime Customers (For Product) Widget
- A pie chart with two slices
- The Number and Percentage of Repeating Customers for the selected marketplace
- The Number and Percentage of One-Time Customers for the selected marketplace
- Clicking on the Customers link at the bottom of the widget will take you to Customers->Customers List in the menu
- This widget reports values since the inception of your Amazon account and disregards the dashboard date settings
- A pie chart with two slices
- The Product Inventory Data Widget
- The inventory position for that product
- Number of In Stock Units
- Number of Inbound Units
- Number of Reserved Units
- Total Stock Quantity
- Inventory Tied Cost
- How much money is invested in the stock
- Local Inventory x Current COGS for the product
- Local Inventory
- Inventory available at Amazon in the specific Marketplace of the product
- In Transit
- Number of units as defined in the In Transit Product Setting
- In Warehouse
- Number of units as defined in the In Warehouse Product Setting
- Age Level
- A breakdown of the age of the inventory
- Number of Units below 90 days of age
- Number of Units between 91 and 180 days of age
- Number of Units between 191 and 270 days of age
- Number of Units between 271 and 365 days of age
- Number of Units over 365 days of age
- A breakdown of the age of the inventory
- Sales velocity
- The average number of units sold per day over the number of days specified
- Days of Inventory left
- Based on sales velocity
- Recommended Reorder Date
- Based on inventory product settings for
- Restock Lead Time
- Velocity
- MOQ
- Days Of Cover Required
- Crate Quantity
- Crate Rounding Rule
- Based on inventory product settings for
- The inventory position for that product
Related Posts
- How Do I Organize Marketplace, Product and Customer Dashboards?
- How Do I Color-code Widgets On Dashboards?
- The Customer Segmentation Settings Screen
- What Is Period-Based Cost-Of-Goods?
- The Cost-Of-Goods Screen
- How Do I Define A Cost Of Goods For A Product?
- How Does SellerLegend Determine The COGS For An Order?
- How Do I Know Which Dates To Use In COGS Periods When New Stock Arrives?
- The Other Operating Expenses Settings Screen
- Defining One-Time And Recurring Expenses
- The Incurred Expenses Screen
- How Do I Define A Product’s VAT Rate?
- The Europe VAT Settings Screen