Select the Foreign Exchange Rates Menu Entry, under the Account Settings section, or
Anywhere there is a Currency Selector, click on the icon to the right of the selected currency
What is it for?
See the historical rates that SellerLegend uses to perform its currency conversion calculations
View an FX chart overtime for all currencies carried in SellerLegend
Query the history of exchange rates, for example, locating the dates when GBP was trading between $1.20 to $1.22 to the dollar over the past 30 days
What Is The Source Of The Historical Exchange Rates?
The history of currency exchange rates that we use in SellerLegend comes from the European Central Bank (ECB) and refreshes every six hours.
The exchange rate history goes back to the inception of the Euro on Jan 4, 1,999
We are using the middle rate, also called the mid or mid-marketrate, which is the exchange rate between a currency’s bid and ask rates.
The middle rate is calculated using the median average of the bid and asks (offer) rates.
Screenprint
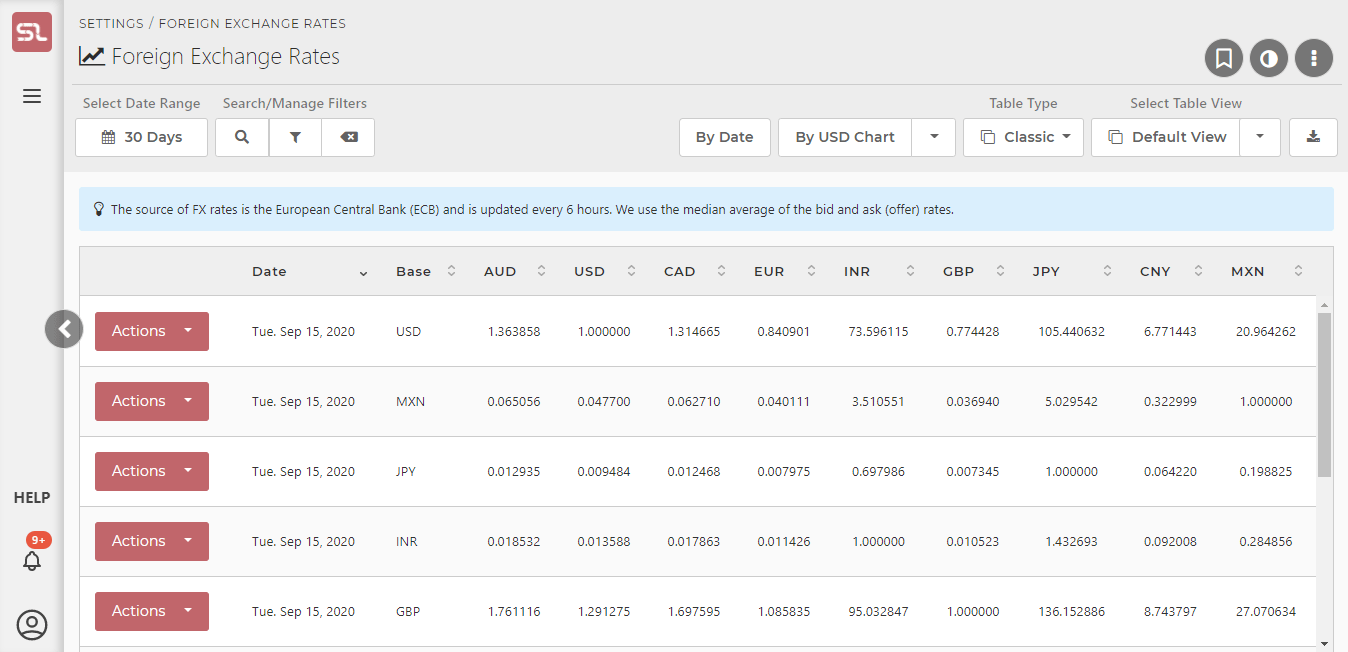
Historical Rates View
This screen contains one row per day per currency
The first column is the Base currency. This is the source currency, the one we want to convert from
The columns to the right of the Base currency are the Destination currencies, the ones we want to convert the base currency to
For example, in the screenshot below, you can see that on Monday, June 1st, 2020, one USD was the equivalent of 1.483267 Australian $, 1.369917 Canadian $, 0.899604 Euro, etc.
Remember that by using the Views button in the taskbar at the top right of the screen, you can rearrange the sequence of the columns to your convenience. So you could cluster your most important currencies to the right of the table if desired.
The By [currency] Chart button allows you to display a historical rate chart with the [currency] as the base and all other currencies plotted against the base. (see following screen description below)
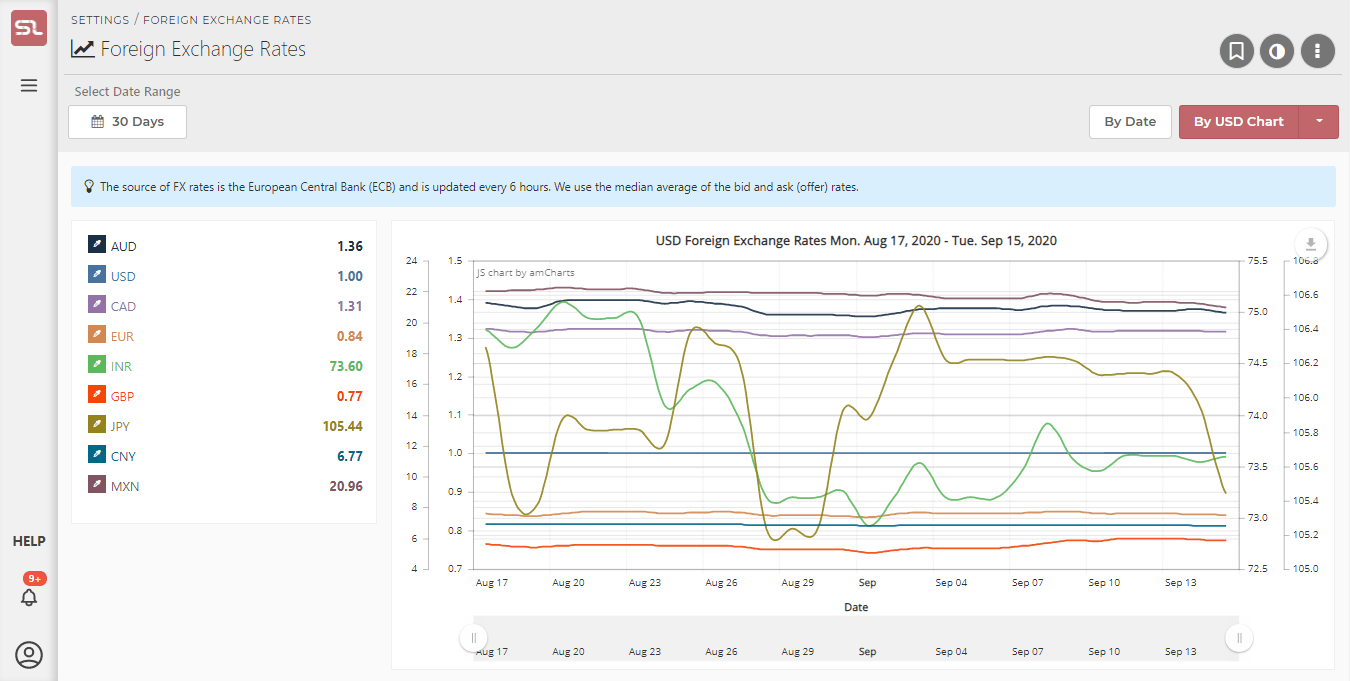
Historical Rates Chart
This screen displays a historical rate chart with a currency of your choice as the base and all other currencies plotted against the base.
Hovering over the chart area will show the rates at a specific date on the chart legend to the left of the screen
You can select a different currency as the base by selecting the appropriate entry from the By [currency] Chart button at the top right of the screen
You can return to the daily currency exchange rate table by clicking on the By Date button
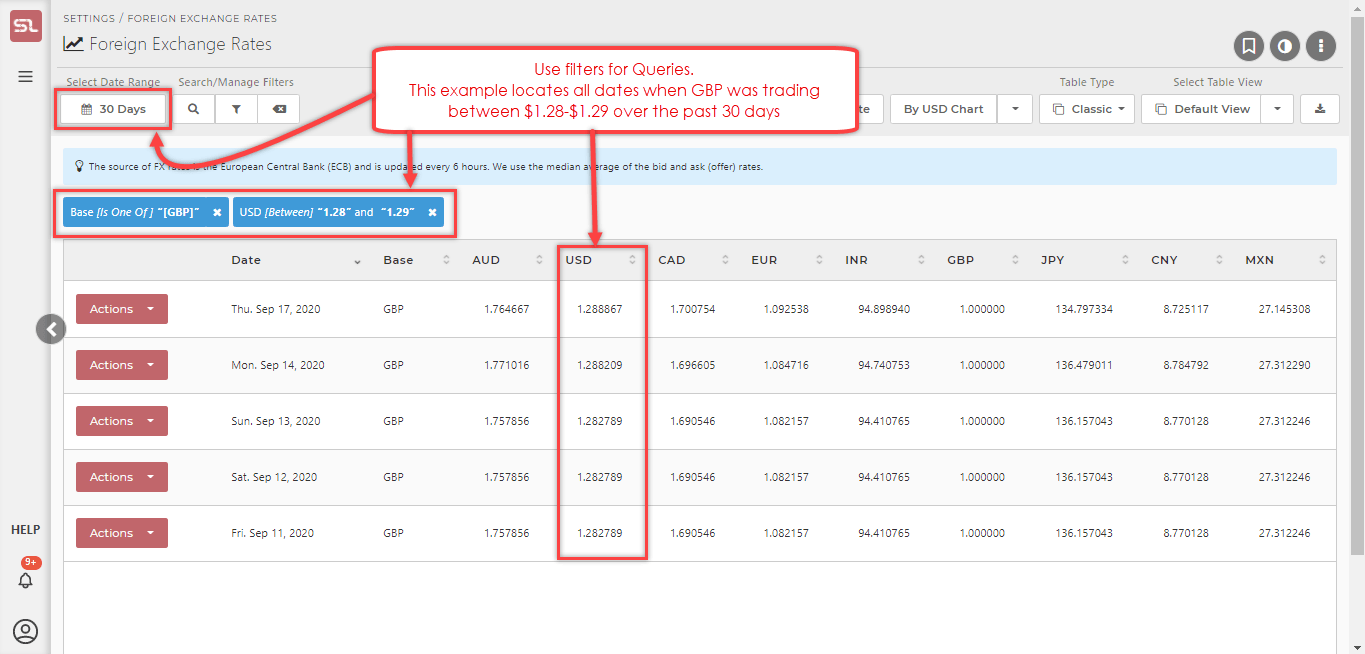
Historical Rates Queries
By using the Filters (accessed by clicking on the funnel icon on the taskbar) you can query the historical rates
The example shown below demonstrates the use of the filters to find the instances over the past 30 days when GBP was trading between $1.28 and $1.29