How To Get Here?
- From the Menu
- PPC–>PPC Dashboard
What is it for?
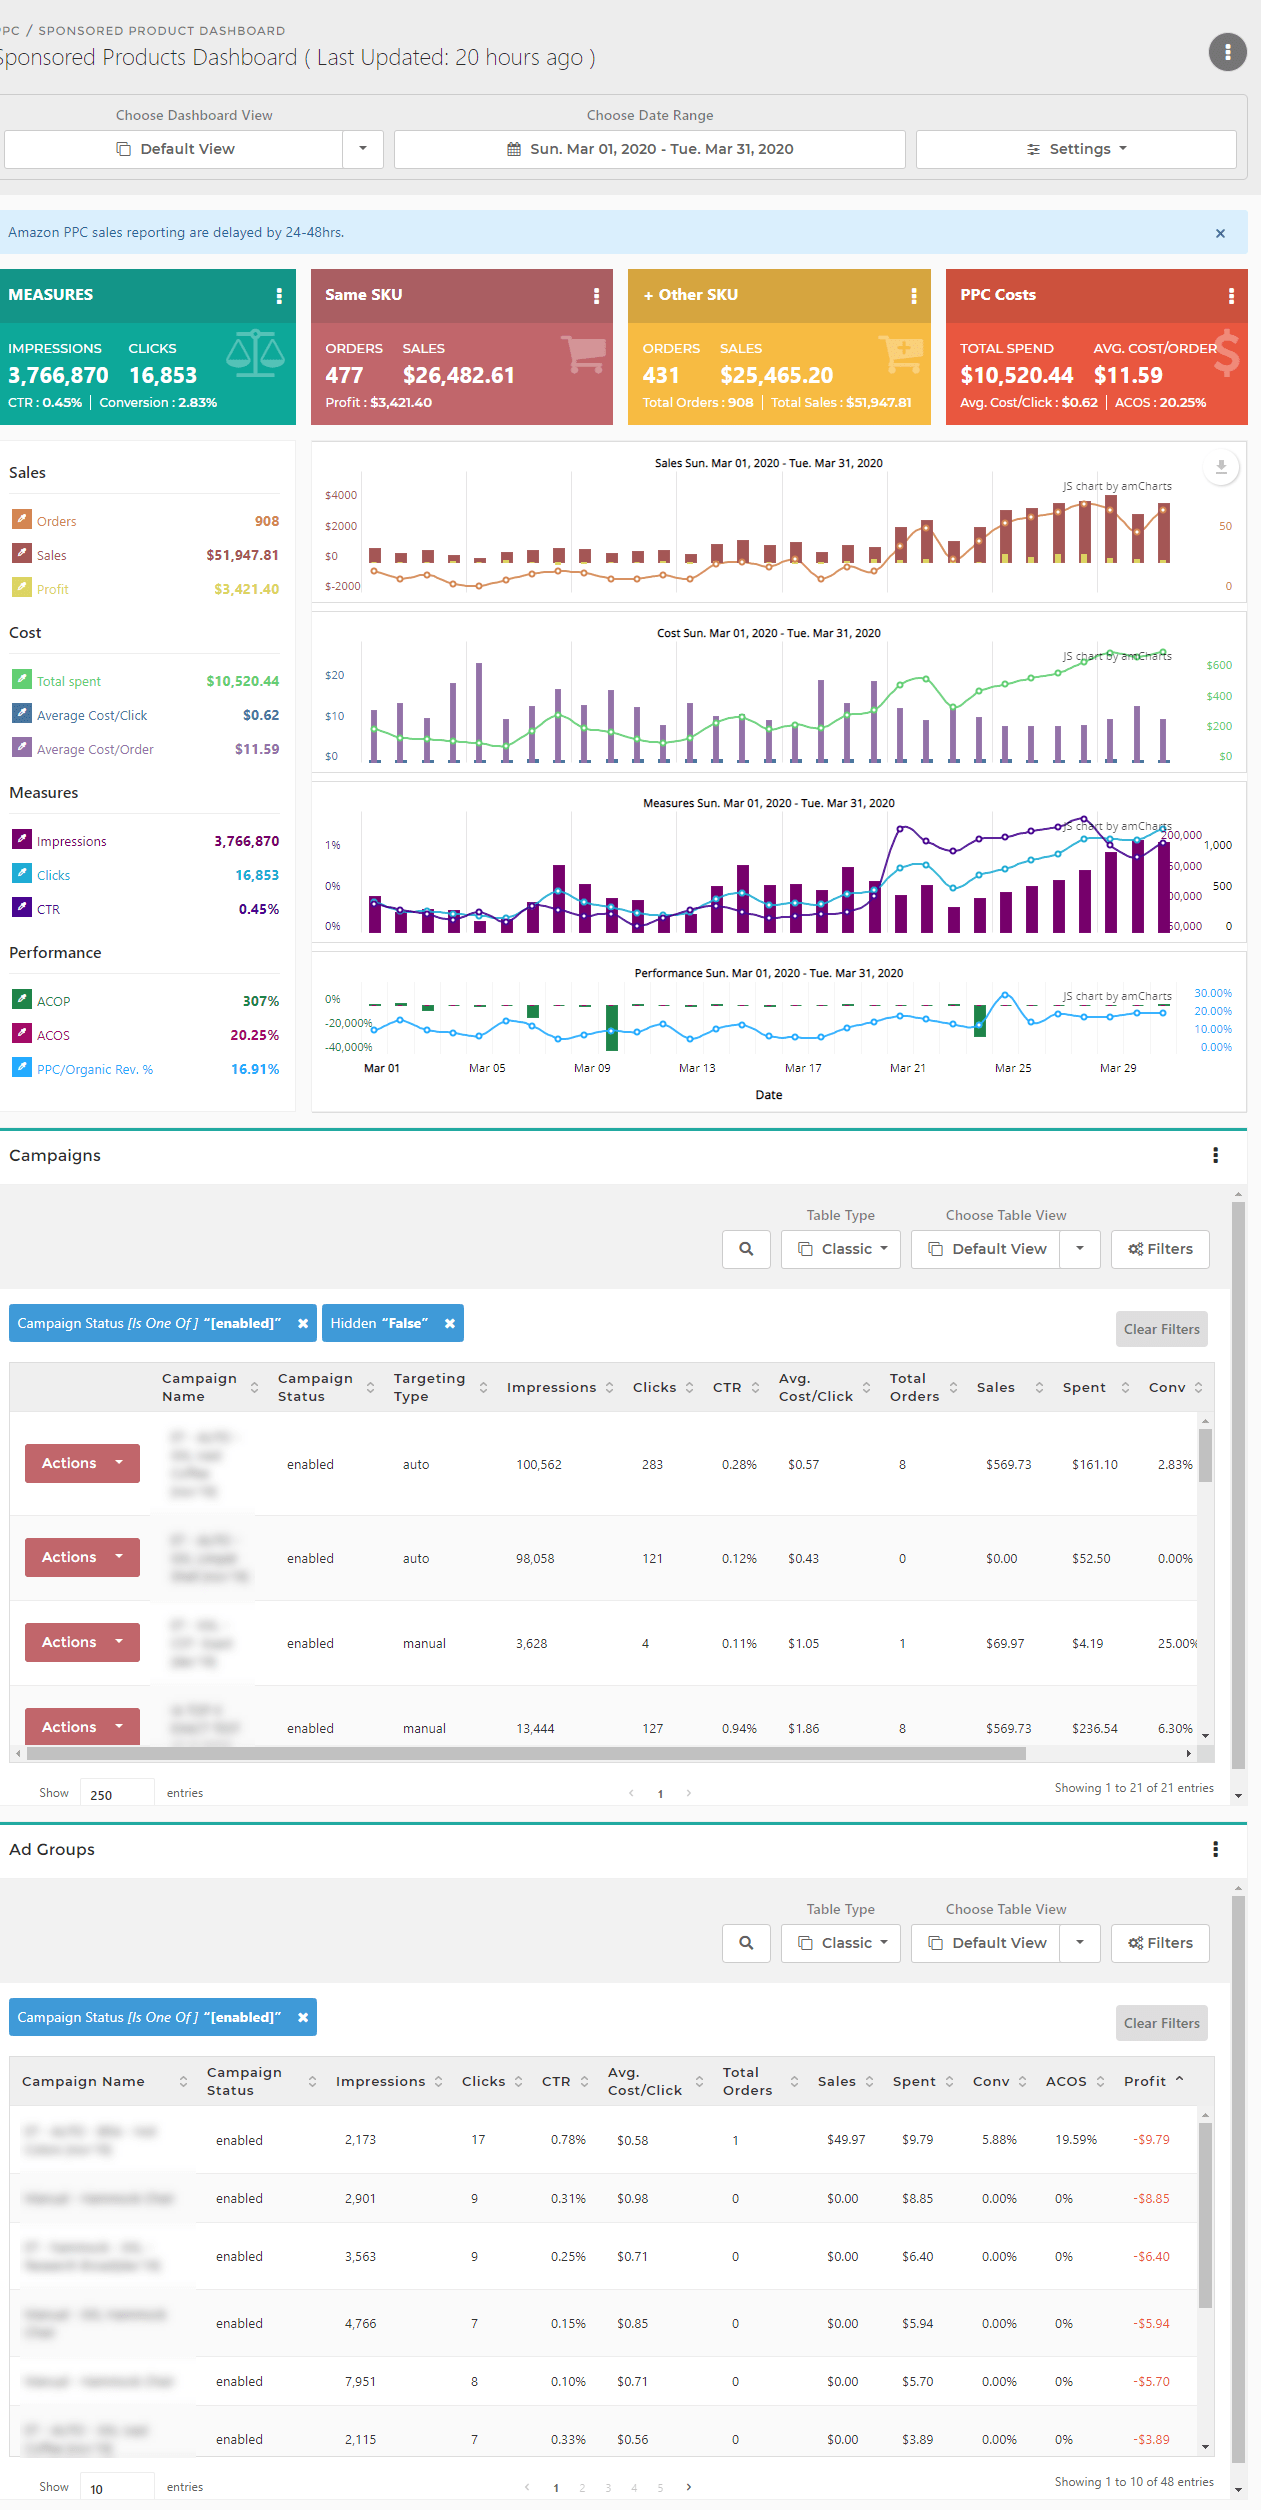
- The PPC Dashboard allows you to view your PPC data at a glance, marketplace by marketplace, for a specified date range which you can set by clicking on the Date Range Selector
- This dashboard will show data relevant to one Account/Marketplace at a time
- If you have more than one Account/Marketplace, clicking on the Marketplace Selector at the top right of the screen will allow you to select the Account/Marketplace of your choice.
Hints And Tips!
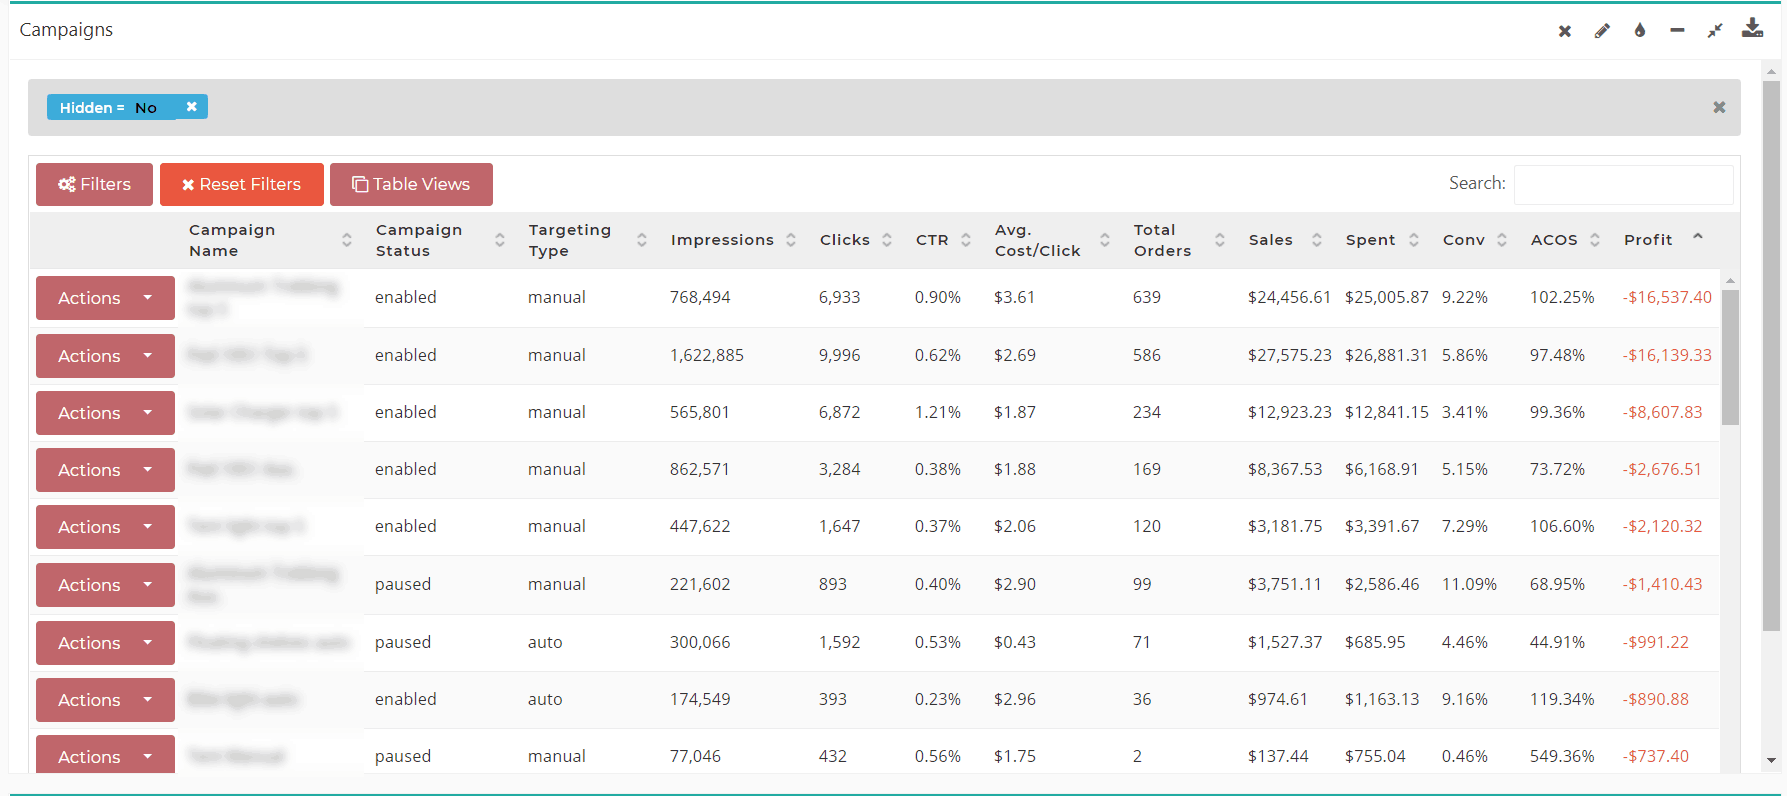
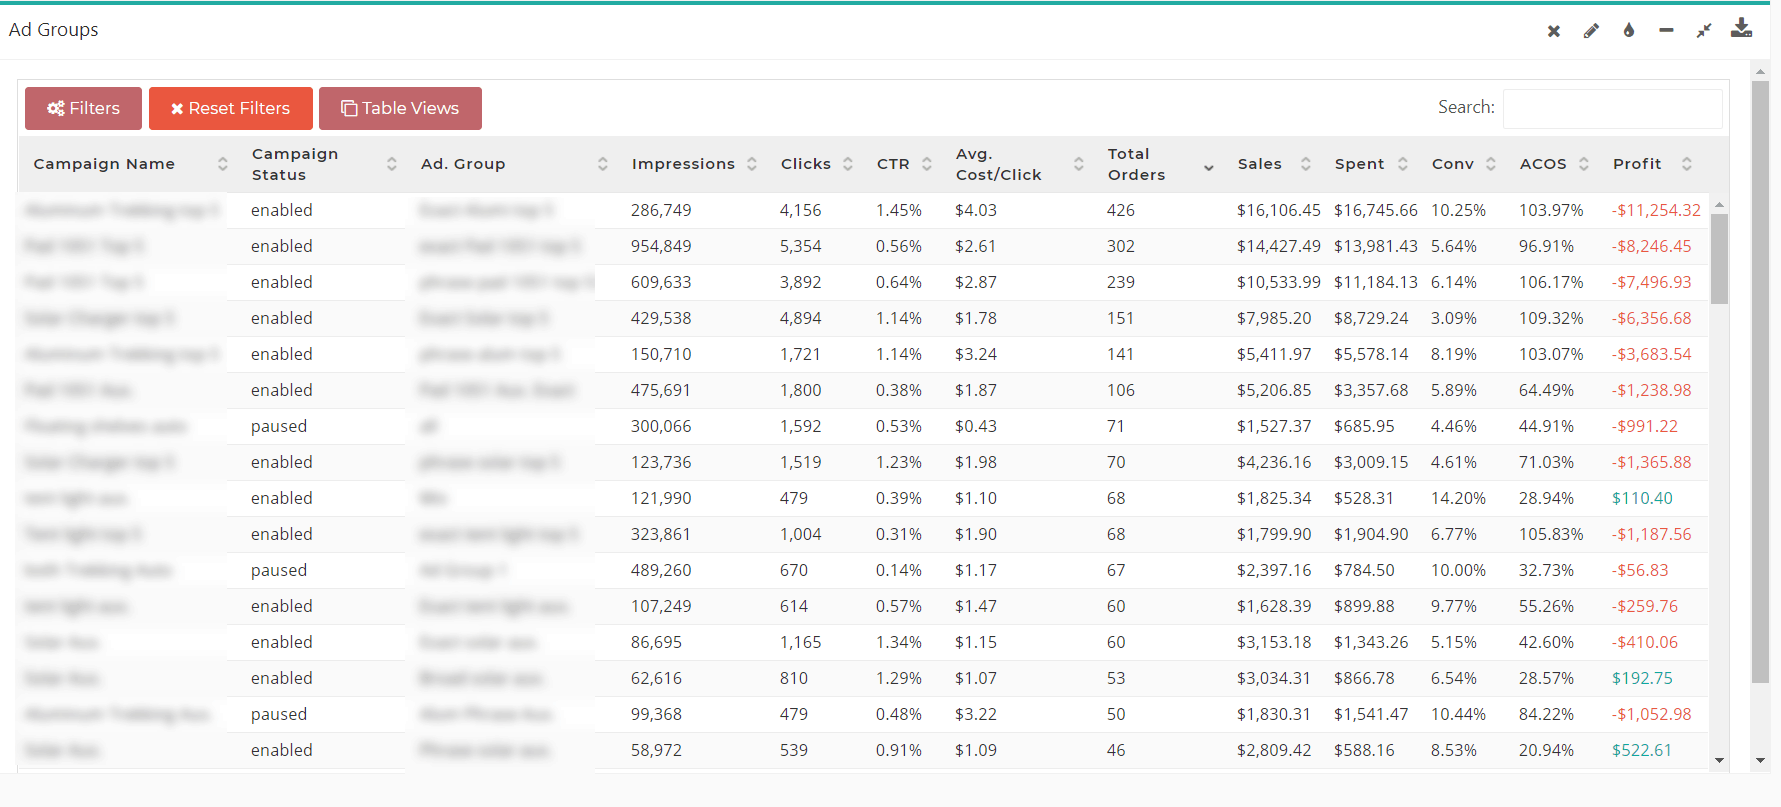
- In the widgets that you see here, you can use Filters and the Search box just like you would on a normal screen. Think of these widgets as mini-screens.
- You can also change the view (i.e. hide/un-hide fields) by clicking on the Table View button, just as you would on the View manager on normal screens.
- In the case of Keyword Performance and Term Performance widgets are not available on this screen, you can find them on the side menu under PPC.
Screen Print

Content
(*) denotes features not yet implemented at the time of writing
- Dashboard Marketplace Selector
-
- Use this drop-down box to select which Marketplace to show on the Dashboard
- You can only display one Marketplace at a time
- The PPC Dashboard Marketplace Selector will be absent if you only have one Marketplace
- Performance Indicator Tiles

- Each tile shows a different aspect of how your overall PPC performance is going
- The figures on these tiles depend on the time period selected.
- The PPC Chart Legend

- There are four categories, and a chart for each one of those. The legend on the left contains the details. Clicking on any subcategory will hide/unhide that value from the respective chart:
- Sales
- Cost
- Measures
- Performance
- Also dependent on the selected time period.
- There are four categories, and a chart for each one of those. The legend on the left contains the details. Clicking on any subcategory will hide/unhide that value from the respective chart:
- Campaigns Widget
- This widget shows you all the details about each of your campaigns

- This widget shows you all the details about each of your campaigns
- Ad Group Widget
- A campaign can have one or more Ad Groups. This widget displays all PPC related data for each Ad Group. Shows the same fields as Campaigns widget.

- A campaign can have one or more Ad Groups. This widget displays all PPC related data for each Ad Group. Shows the same fields as Campaigns widget.
Table Fields
- Impressions
- The number of impressions received
- Clicks
- The number of clicks received
- CTR (Click-Through-Rate)
- The number of clicks compared to the number of impressions. i.e. the ratio of users that viewed an ad AND clicked it.
- CTR = Impressions / Clicks
- Avg Cost/Click
- The average cost of a click.
- Calculated as Number of Clicks / Amount Spent
- Total Orders
- Total number of orders received against the respective field (i.e. campaign, ad group, keyword, or term).
- This is a sum of Same SKU Orders and Other SKU Orders.
- Other SKU is when an order is placed for a SKU that is different than the one which was advertised for. There is no way to tell which specific SKU was ordered as a result of a certain ad.
- Sales
- The sales revenue due to the respective field
- Similar to Total Orders, this is a sum of Same SKU Sales and Other SKU Sales.
- Spent
- The amount you spent for the respective field.
- Conv
- The percentage of clicks that result in orders.
- The ratio of Total Orders to Clicks
- Conv = Total Orders / Click * 100
- ACOS (Advertising Cost of Sales)
- The percentage of amount you spent on advertisement as compared to the sales you made as a result of that advertisement.
- ACOS = total ad spend / total ad sales x 100
- Match Type
- Three possible options: broad, phrase, and exact
- With each type, the search gets more and more restrictive, as the name should imply.
- Targeting Type
- Two possible values: automatic and manual
- With Automatic Campaigns, you select budgets and Amazon automatically finds keywords that match your product’s category, related products, and your product’s descriptions.
- With Manual Campaigns, you handpick keywords you want to bid on.


